| Supplementary data of the associated publication Start Page |
|
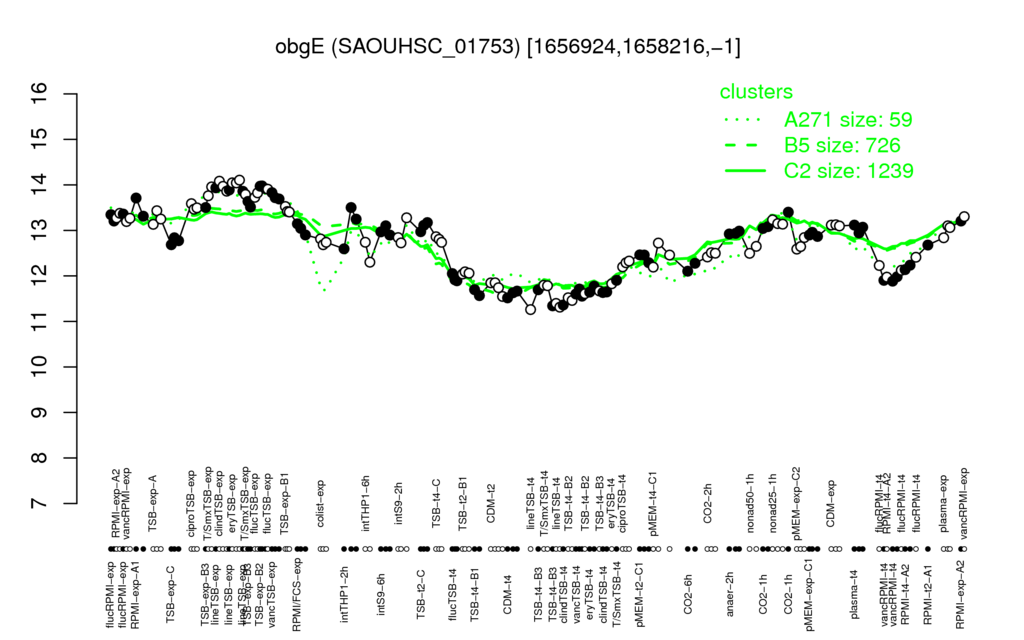
| eryTSB-exp | clindTSB-exp | TSB-exp-B2 | lineTSB-exp | T/SmxTSB-exp |
| 14.1 | 14 | 14 | 13.9 | 13.8 |
| lineTSB-t4 | TSB-t4-B2 | clindTSB-t4 | TSB-t4-B3 | CDM-t4 |
| 11.3 | 11.5 | 11.5 | 11.6 | 11.6 |
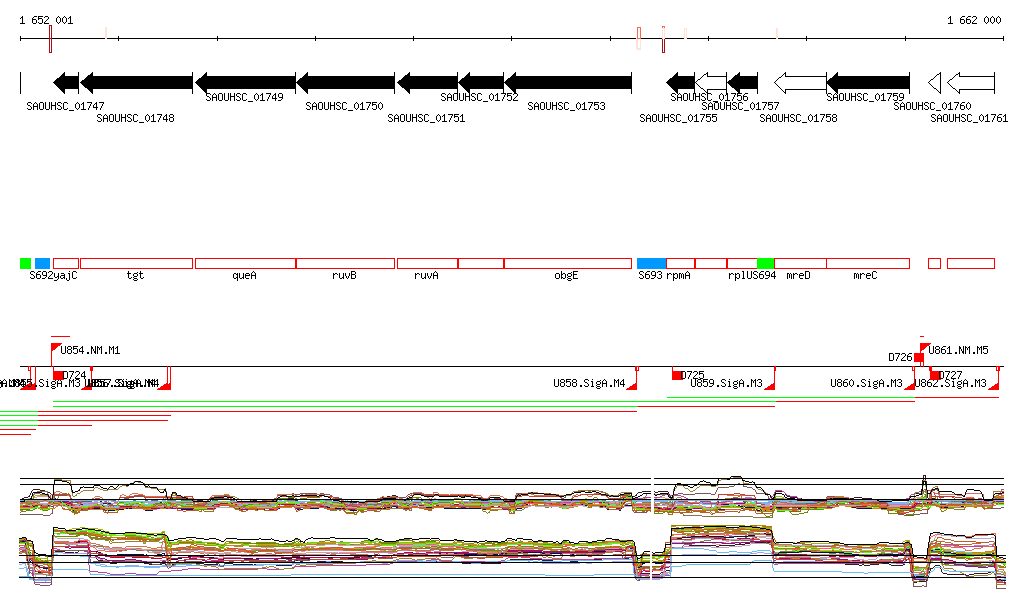
| SAOUHSC_01752 | ruvA | cdsA | uppS | lepA | prfA | accC | tilS | S511 | S668 |
| 0.97 | 0.95 | 0.94 | 0.93 | 0.93 | 0.93 | 0.93 | 0.93 | 0.92 | 0.92 |
| SAOUHSC_00841 | SAOUHSC_00792 | S316 | SAOUHSC_00840 | S315 | SAOUHSC_02928 | S339 | S1012 | SAOUHSC_00287 | S844 |
| -0.92 | -0.91 | -0.91 | -0.9 | -0.9 | -0.89 | -0.89 | -0.89 | -0.89 | -0.88 |