| Supplementary data of the associated publication Start Page |
|
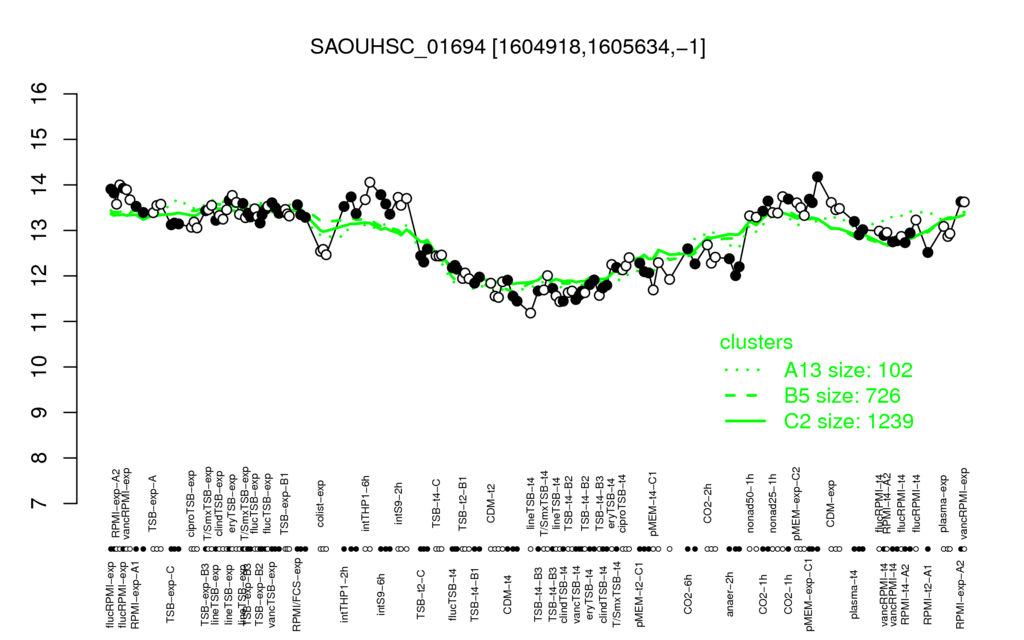
| flucRPMI-exp | intTHP1-6h | pMEM-exp-C1 | RPMI-exp-A2 | vancRPMI-exp |
| 13.9 | 13.9 | 13.8 | 13.7 | 13.7 |
| lineTSB-t4 | vancTSB-t4 | CDM-t4 | TSB-t4-B2 | TSB-t4-B3 |
| 11.4 | 11.6 | 11.6 | 11.6 | 11.7 |
| rsfS | S372 | cshA | proS | spsA | S164 | SAOUHSC_01239 | SAOUHSC_02587 | S894 | rho |
| 0.93 | 0.92 | 0.92 | 0.92 | 0.91 | 0.91 | 0.91 | 0.91 | 0.91 | 0.91 |
| pnbA | SAOUHSC_00320 | SAOUHSC_02244 | S1065 | SAOUHSC_00318 | SAOUHSC_02908 | S269 | SAOUHSC_02928 | SAOUHSC_00319 | secA2 |
| -0.92 | -0.9 | -0.89 | -0.89 | -0.89 | -0.89 | -0.89 | -0.89 | -0.89 | -0.89 |