| Supplementary data of the associated publication Start Page |
|
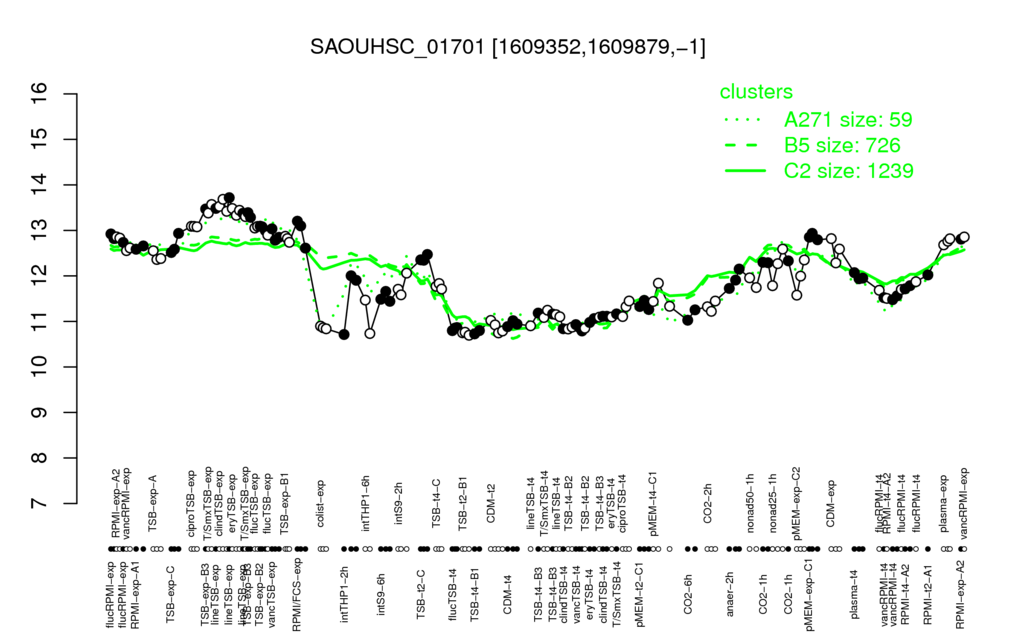
| clindTSB-exp | lineTSB-exp | eryTSB-exp | T/SmxTSB-exp | TSB-exp-B3 |
| 13.5 | 13.5 | 13.4 | 13.4 | 13.4 |
| TSB-t2-B1 | TSB-t4-B1 | flucTSB-t4 | TSB-t4-B2 | vancTSB-t4 |
| 10.7 | 10.8 | 10.8 | 10.9 | 10.9 |
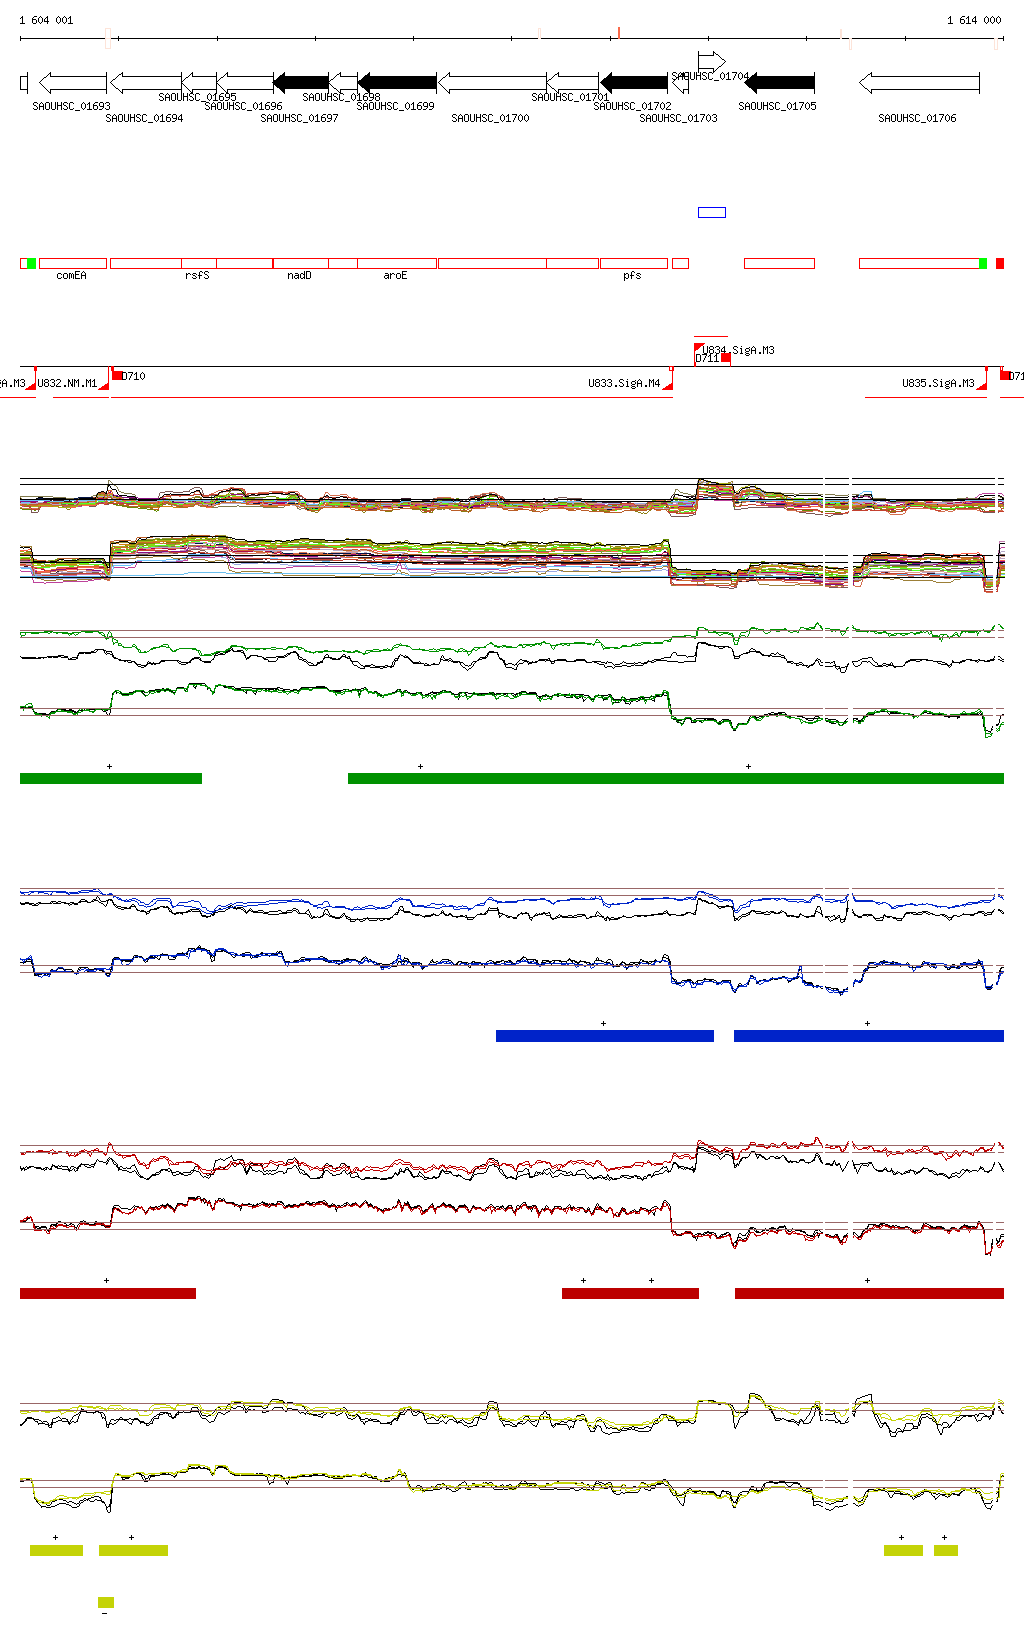
| SAOUHSC_01700 | pfs | pcrB | pyrH | accC | pcrA | parC | SAOUHSC_01156 | tilS | hpt |
| 0.98 | 0.97 | 0.95 | 0.95 | 0.94 | 0.94 | 0.94 | 0.93 | 0.93 | 0.93 |
| SAOUHSC_00767 | SAOUHSC_01864 | SAOUHSC_02145 | butA | SAOUHSC_01819 | SAOUHSC_00823 | spoVG | SAOUHSC_00824 | SAOUHSC_00962 | S1128 |
| -0.91 | -0.9 | -0.89 | -0.89 | -0.89 | -0.88 | -0.88 | -0.87 | -0.87 | -0.87 |