| Start Page |
|
 |
| Start Page |
|
|
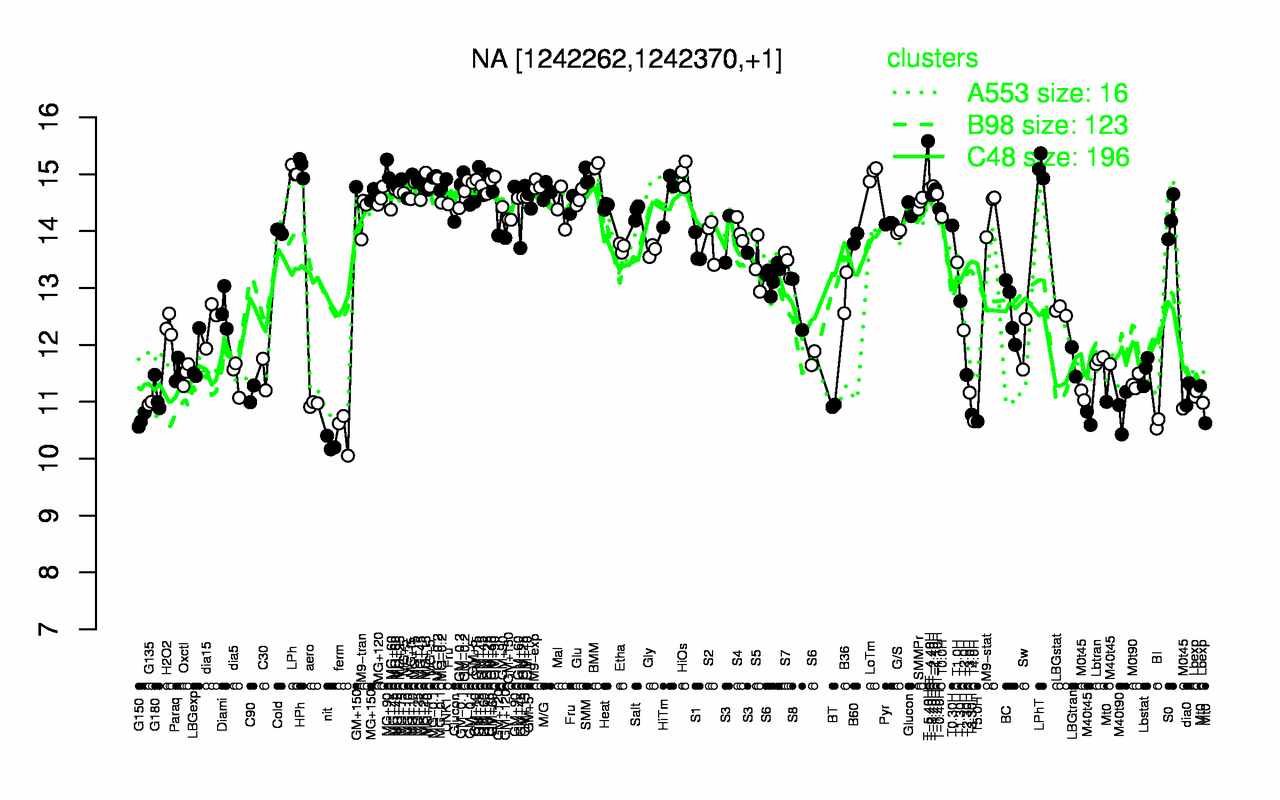
| T-5.40H | BMM | LPhT | HPh | MG+90 | LPh | LoTm | HiOs | SMM | MG+15 |
| 15.6 | 15.1 | 15.1 | 15.1 | 15.1 | 15.1 | 15 | 15 | 14.9 | 14.9 |
| nit | ferm | BI | T5.0H | T4.0H | G150 | T3.30H | M40t90 | BT | aero |
| 10.3 | 10.5 | 10.6 | 10.7 | 10.7 | 10.7 | 10.8 | 10.8 | 10.9 | 11 |