| Start Page |
|
 |
| Start Page |
|
|
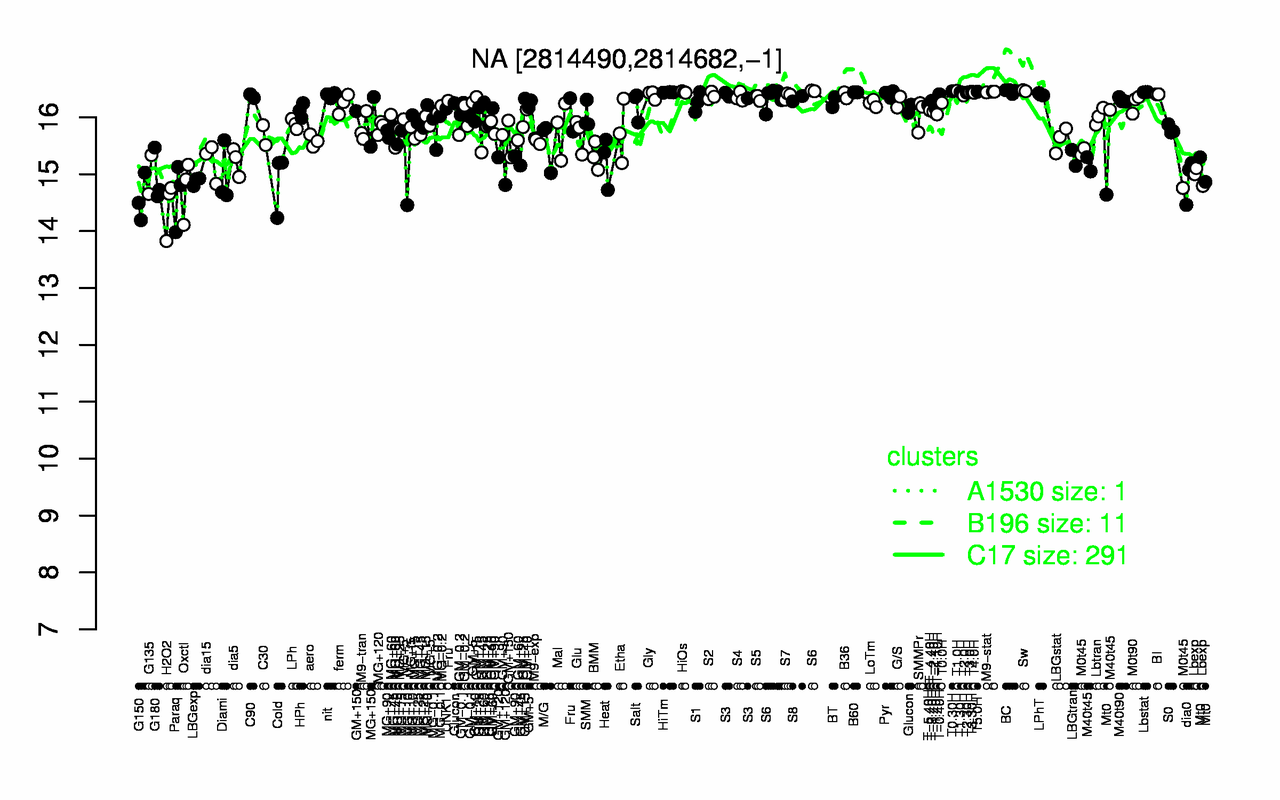
| Sw | T1.0H | T0.30H | BC | T3.30H | T5.0H | M9-stat | HiOs | T1.30H | T3.0H |
| 16.5 | 16.5 | 16.5 | 16.5 | 16.5 | 16.5 | 16.4 | 16.4 | 16.4 | 16.4 |
| H2O2 | G150 | Paraq | Oxctl | LBGexp | Cold | dia0 | Mt0 | G180 | Lbexp |
| 14.4 | 14.6 | 14.6 | 14.7 | 14.9 | 14.9 | 14.9 | 14.9 | 14.9 | 15 |