| Start Page |
|
 |
| Start Page |
|
|
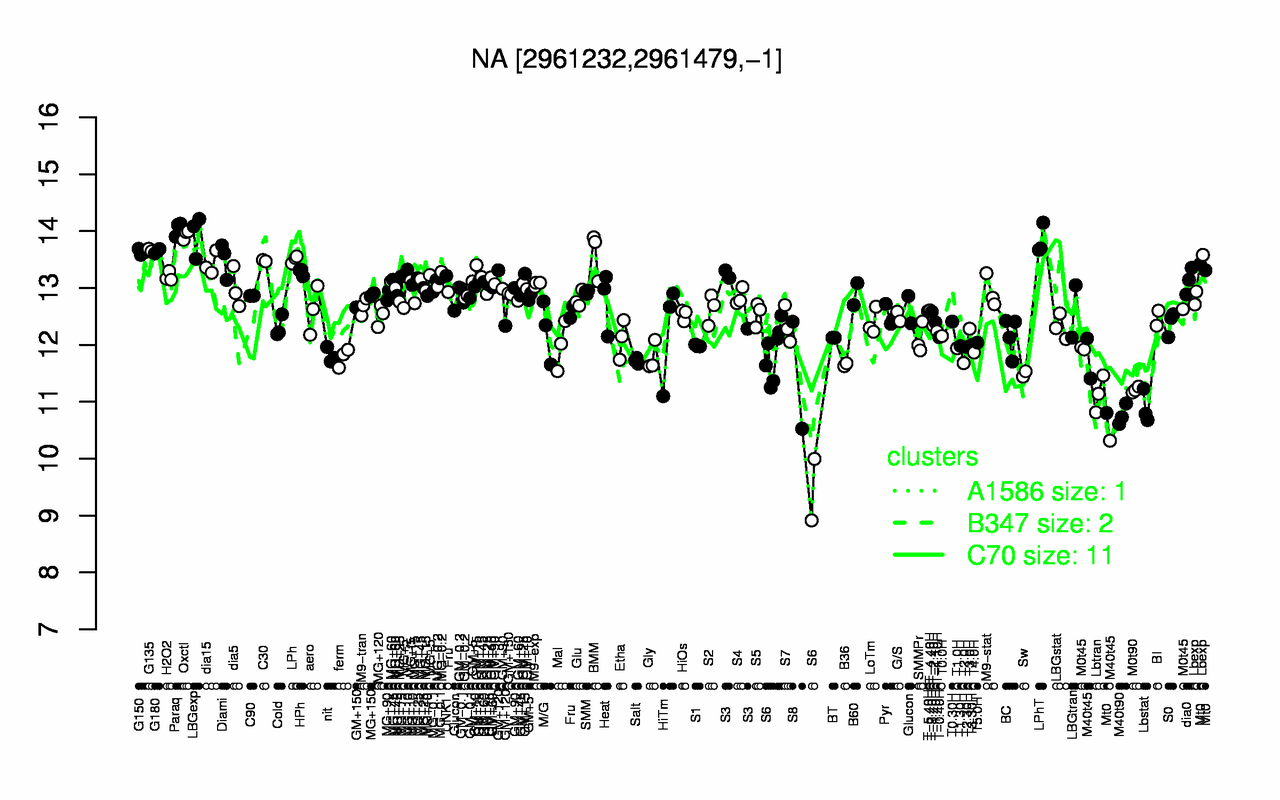
| Paraq | Oxctl | LBGexp | LPhT | G135 | G180 | G150 | BMM | LPh | Diami |
| 14 | 13.9 | 13.9 | 13.8 | 13.7 | 13.6 | 13.6 | 13.6 | 13.5 | 13.5 |
| M40t90 | Lbstat | Lbtran | M0t90 | M40t45 | S6 | S8 | Sw | B36 | T2.0H |
| 10.8 | 10.9 | 11.1 | 11.2 | 11.3 | 11.3 | 11.5 | 11.5 | 11.7 | 11.7 |