| Start Page |
|
 |
| Start Page |
|
|
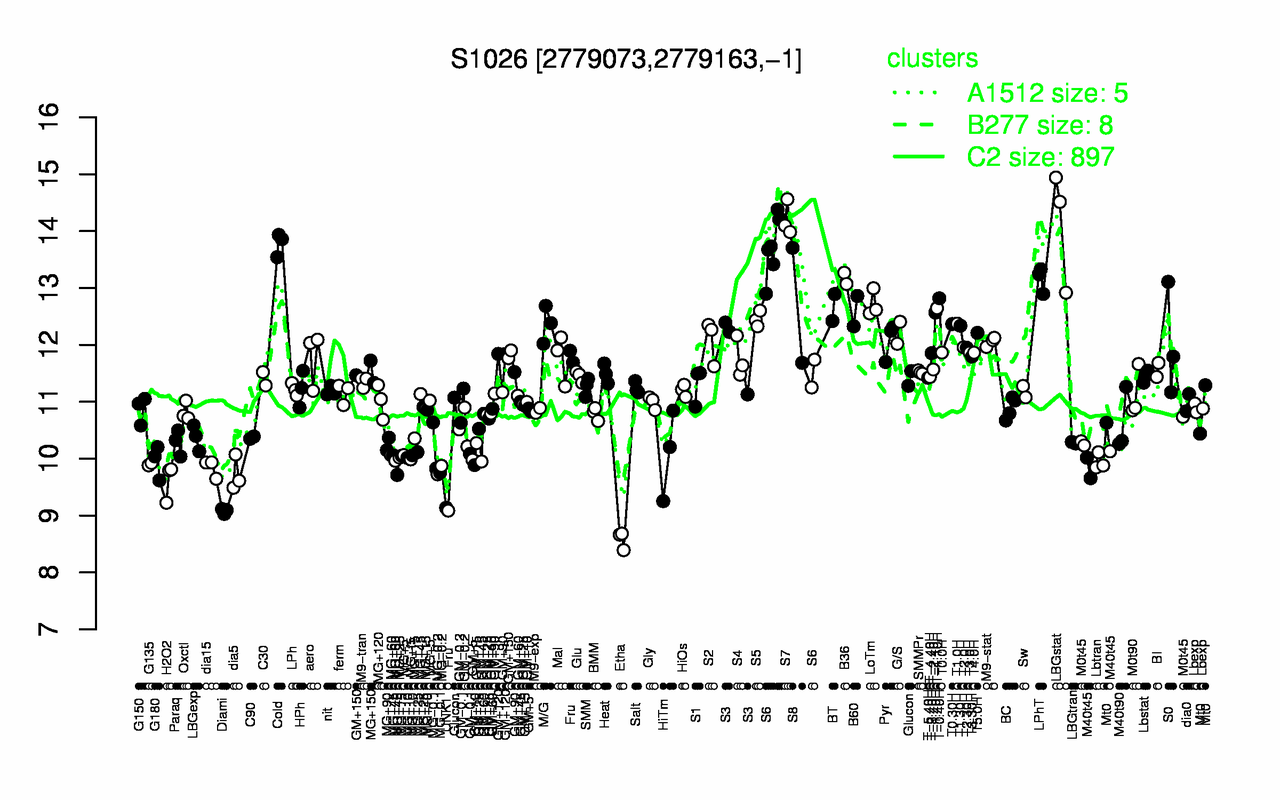
| S7 | LBGstat | Cold | S6 | B36 | LPhT | T-0.40H | LoTm | S8 | BT |
| 14.2 | 14.1 | 13.8 | 13.3 | 13.2 | 13.2 | 12.8 | 12.7 | 12.7 | 12.7 |
| Etha | Diami | UNK1 | H2O2 | dia5 | MG-0.2 | dia15 | G135 | M40t45 | Lbtran |
| 8.58 | 9.08 | 9.14 | 9.61 | 9.72 | 9.8 | 9.84 | 9.9 | 9.93 | 9.95 |