| Start Page |
|
 |
| Start Page |
|
|
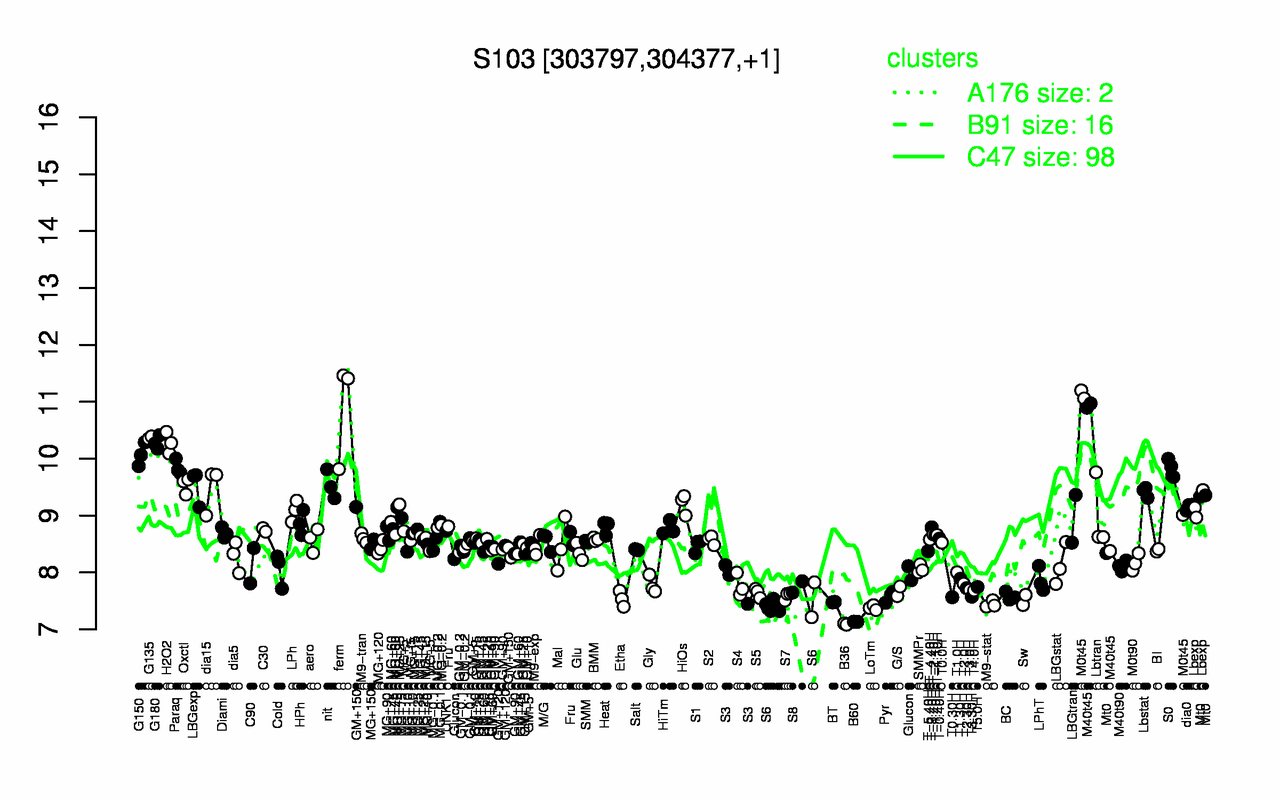
| ferm | M0t45 | G135 | G180 | H2O2 | M40t45 | G150 | Paraq | S0 | nit |
| 10.9 | 10.4 | 10.4 | 10.3 | 10.3 | 10.1 | 10.1 | 9.85 | 9.85 | 9.54 |
| B36 | B60 | LoTm | S6 | M9-stat | BT | Sw | Etha | T0.30H | T3.30H |
| 7.09 | 7.13 | 7.38 | 7.43 | 7.44 | 7.48 | 7.52 | 7.54 | 7.56 | 7.57 |