| Start Page |
|
 |
| Start Page |
|
|
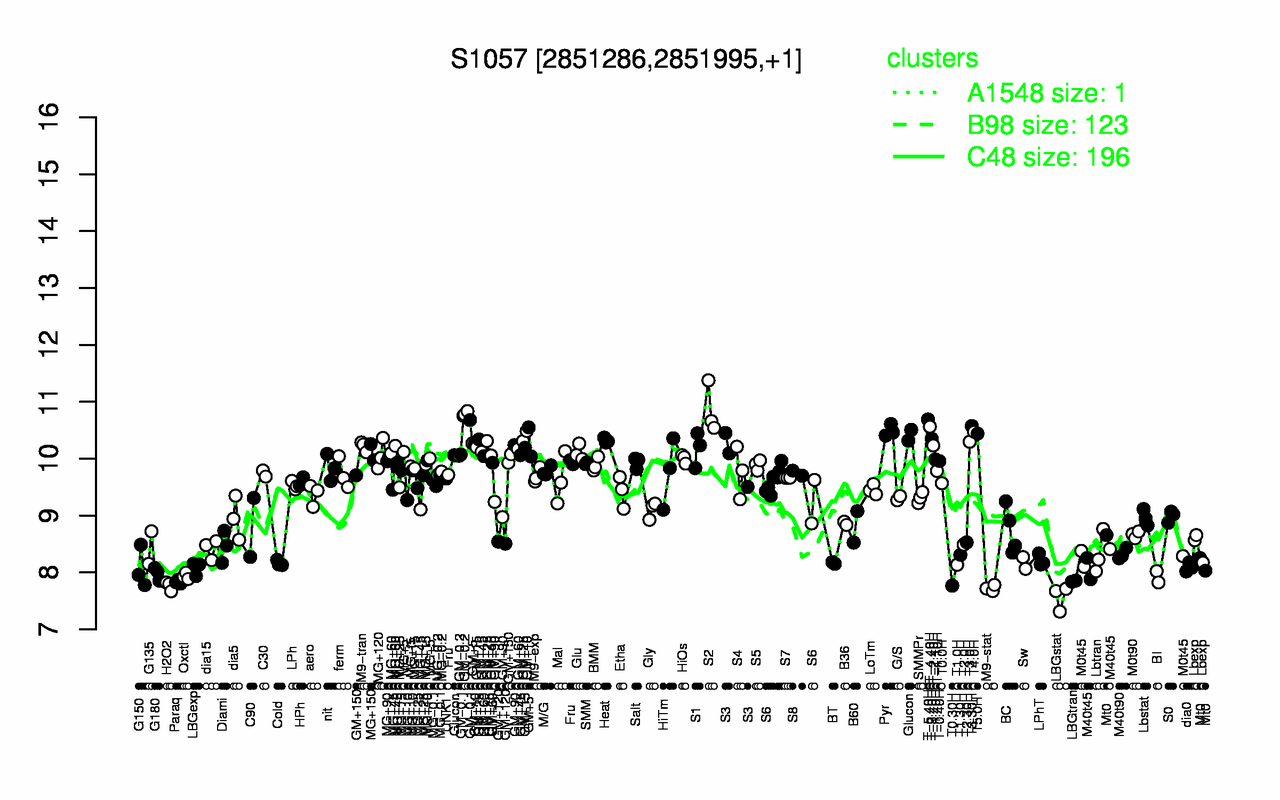
| S2 | T-5.40H | T3.30H | T-4.40H | GM-0.2 | GM-0.1 | Pyr | T4.0H | T5.0H | GM+10 |
| 10.9 | 10.7 | 10.6 | 10.6 | 10.6 | 10.5 | 10.5 | 10.5 | 10.4 | 10.4 |
| LBGstat | M9-stat | H2O2 | T0.30H | Paraq | LBGtran | BI | Oxctl | G180 | G150 |
| 7.57 | 7.72 | 7.76 | 7.77 | 7.83 | 7.85 | 7.92 | 7.94 | 7.98 | 8.07 |