B. subtilis Expression Data Browser
Start Page
B. subtilis Expression Data Browser
Gene/Segment:
S1088
Locus Tag:
new_2951898_2952204
Details about S1088
Show/Hide
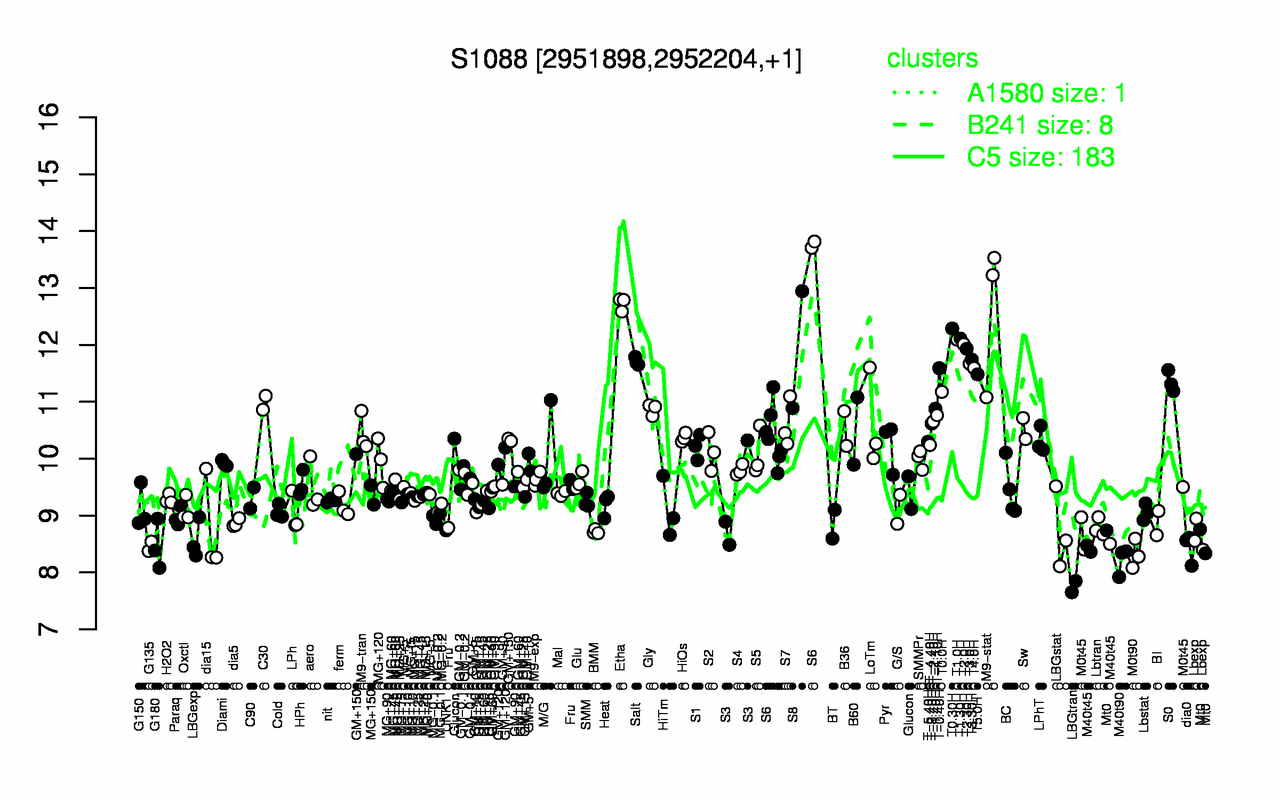
Highest Expression Conditions
Etha
M9-stat
T0.30H
T1.30H
T1.0H
T2.0H
T2.30H
S8
T3.30H
Salt
12.7
12.6
12.3
12.1
12.1
12
11.9
11.9
11.7
11.7
Lowest Expression Conditions
LBGtran
M40t90
M0t90
dia0
M40t45
G135
G180
LBGexp
Mt0
Lbexp
7.75
8.21
8.32
8.43
8.45
8.46
8.47
8.57
8.61
8.63
Most Positively Correlated Segments
yfhL
yfhM
yflB
ysdB
yuaF
yuaI
yuaG
yxjJ
S1495
S680
0.79
0.79
0.75
0.73
0.72
0.72
0.72
0.71
0.69
0.67
Most Negatively Correlated Segments
lgt
yvoD
glmM
tyrS
prpC
proS
prkC
ppaX
coaD
argS
-0.71
-0.7
-0.69
-0.69
-0.69
-0.68
-0.68
-0.67
-0.67
-0.66
Expression Profile of Segment S1088
Show/Hide
Genomic View of Gene/Segment S1088
Show/Hide
(Legend)
Browse Genome Context