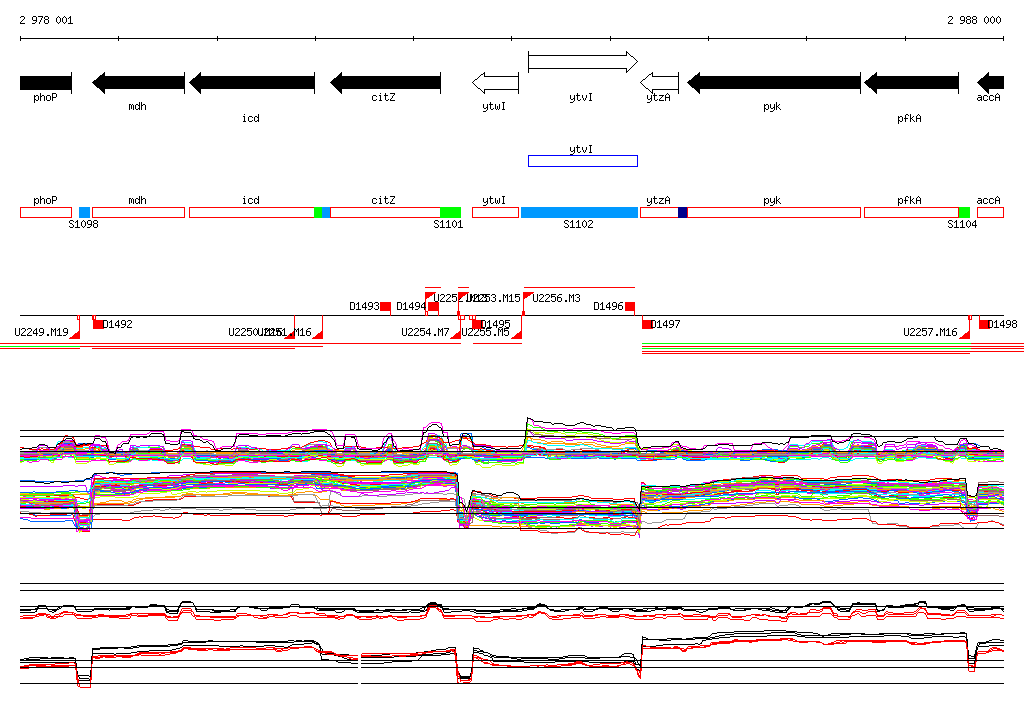
| Start Page |
|
 |
| Start Page |
|
|
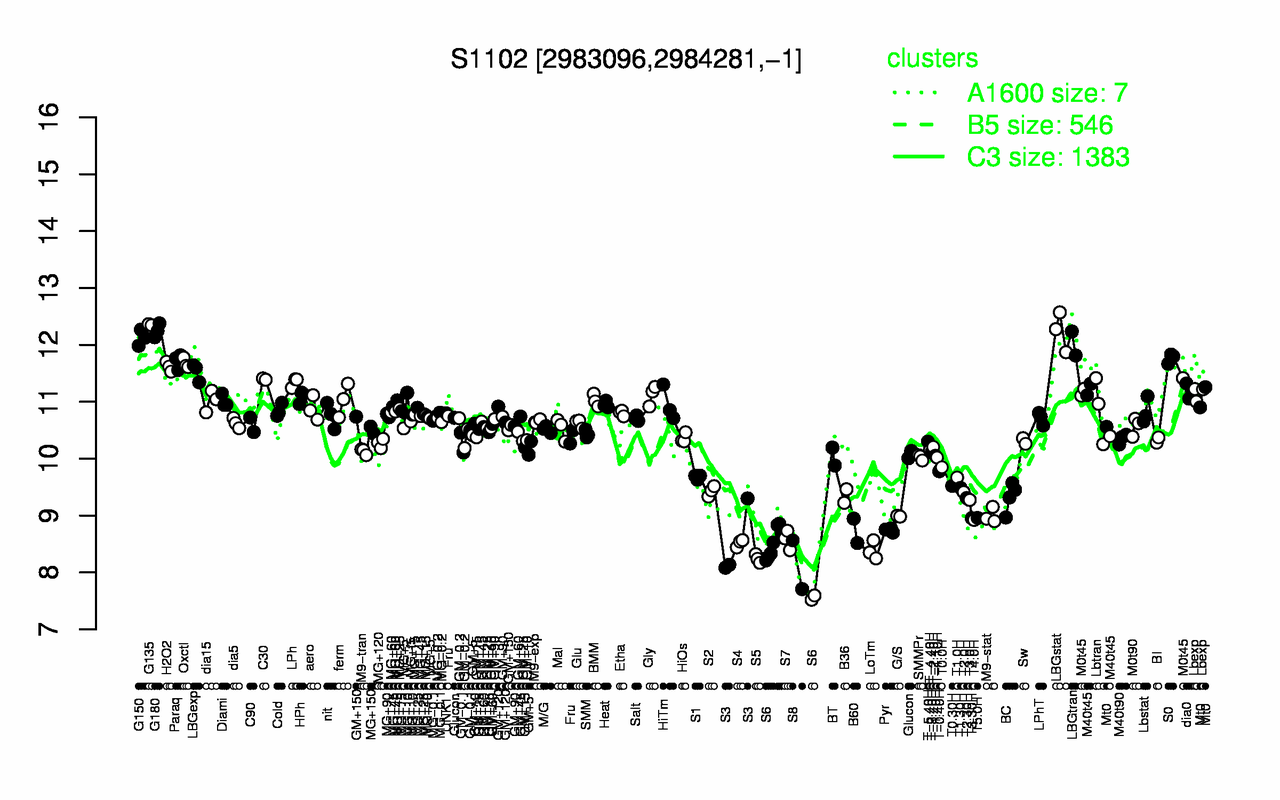
| G135 | G180 | LBGstat | G150 | LBGtran | S0 | Paraq | Oxctl | H2O2 | LBGexp |
| 12.4 | 12.3 | 12.2 | 12.1 | 12 | 11.8 | 11.7 | 11.7 | 11.6 | 11.5 |
| S8 | S5 | S6 | LoTm | S3 | S4 | S7 | B60 | Pyr | T4.0H |
| 8.13 | 8.24 | 8.32 | 8.39 | 8.51 | 8.52 | 8.57 | 8.73 | 8.74 | 8.92 |