B. subtilis Expression Data Browser
Start Page
B. subtilis Expression Data Browser
Gene/Segment:
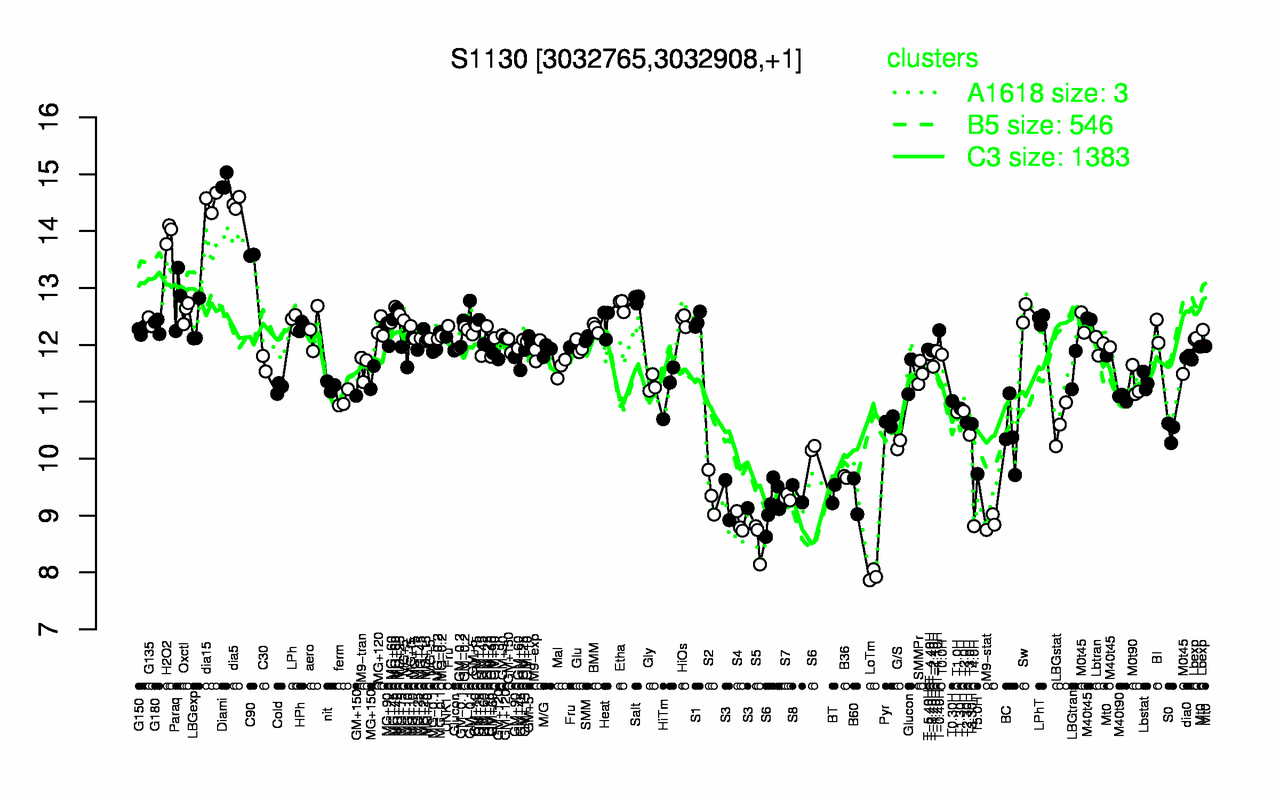
S1130
Locus Tag:
new_3032765_3032908
Details about S1130
Show/Hide
Highest Expression Conditions
Diami
dia15
dia5
H2O2
C90
Paraq
Salt
Etha
Oxctl
Sw
14.9
14.5
14.5
14
13.6
12.8
12.8
12.7
12.6
12.6
Lowest Expression Conditions
LoTm
S5
T4.0H
S4
M9-stat
S3
S7
B60
BT
S8
7.95
8.57
8.81
8.87
8.87
9.22
9.32
9.34
9.38
9.38
Most Positively Correlated Segments
S1131
S1129
yqhM
ydeO
S1440
ycgK
pdxK
yunE
ybgA
yvrG
0.95
0.88
0.86
0.83
0.83
0.82
0.82
0.82
0.82
0.82
Most Negatively Correlated Segments
spoIIIAH
spoIIAB
rsfA
spoIIIAG
sigF
glgB
S924
spoIIIAF
spoIIAA
sinI
-0.83
-0.83
-0.83
-0.83
-0.83
-0.83
-0.83
-0.82
-0.82
-0.82
Expression Profile of Segment S1130
Show/Hide
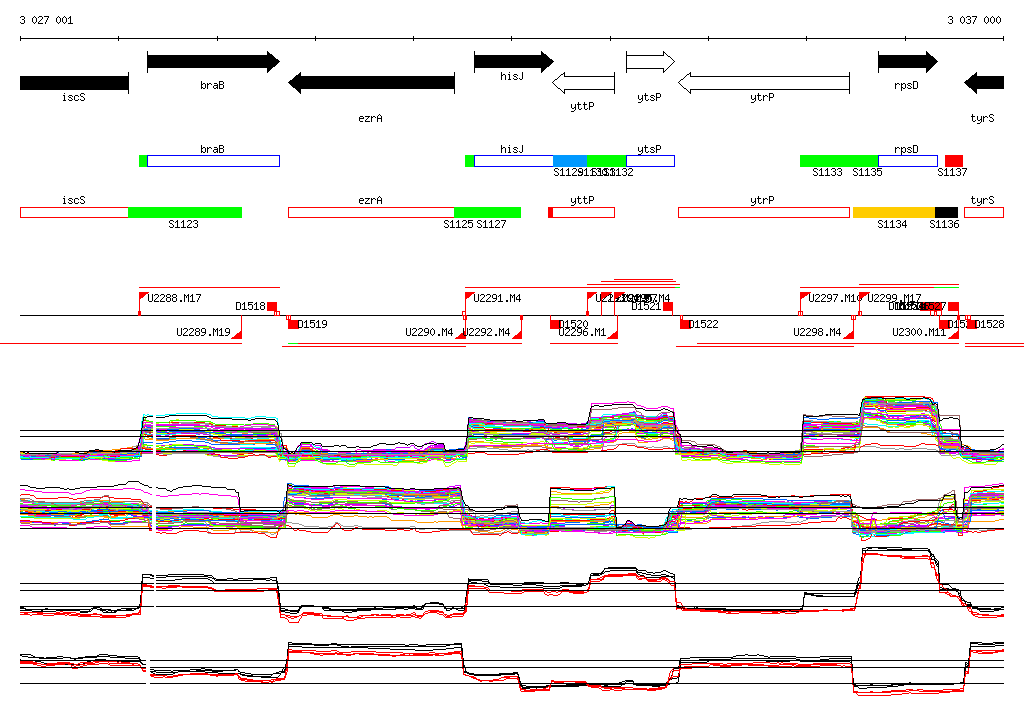
Genomic View of Gene/Segment S1130
Show/Hide
(Legend)
Browse Genome Context