B. subtilis Expression Data Browser
Start Page
B. subtilis Expression Data Browser
Gene/Segment:
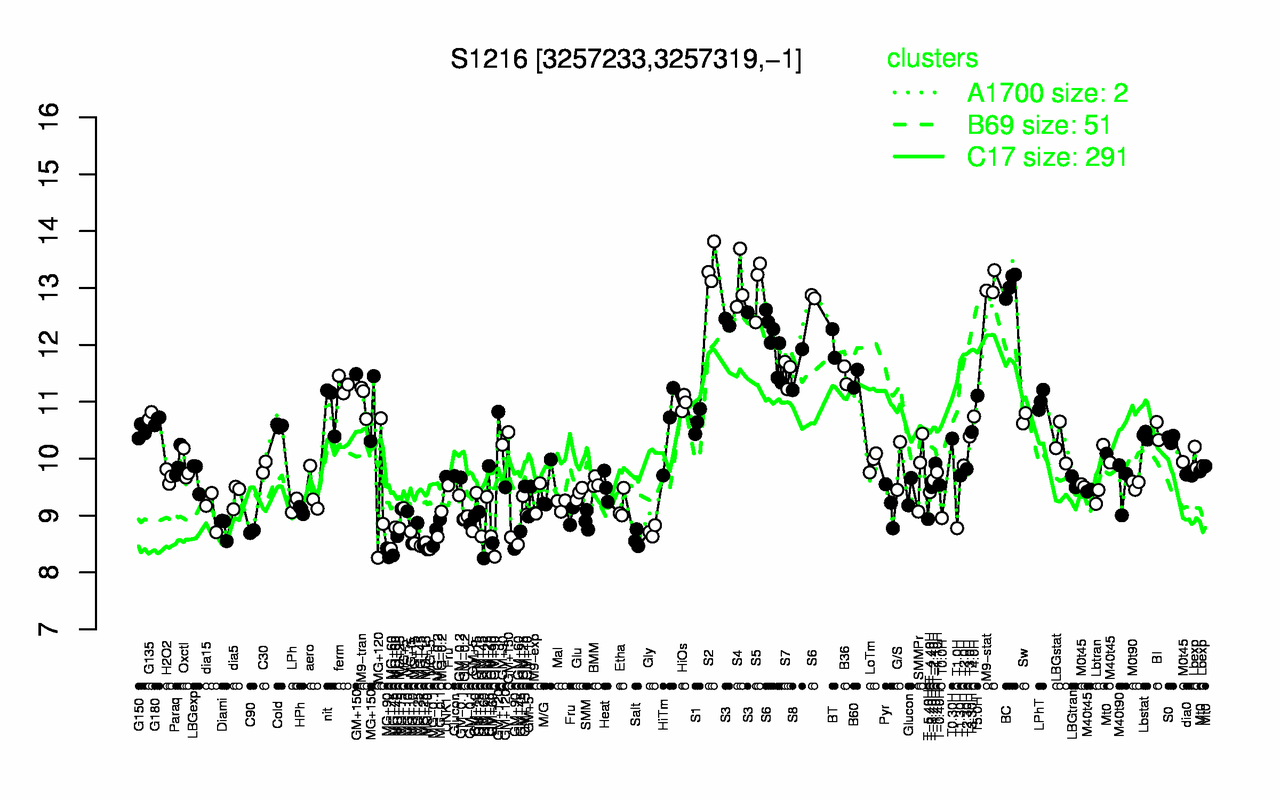
S1216
Locus Tag:
new_3257233_3257319_c
Details about S1216
Show/Hide
Highest Expression Conditions
S2
S4
BC
M9-stat
S5
S3
S6
BT
S8
S7
13.4
13.1
13.1
13.1
13
12.5
12.2
12
11.6
11.5
Lowest Expression Conditions
MG+90
GM+60
MG+45
Salt
MG+60
GM+45
MG+10
MG+25
C90
MG-0.1
8.35
8.42
8.47
8.59
8.6
8.66
8.66
8.71
8.72
8.72
Most Positively Correlated Segments
degQ
yodL
yttP
S427
bpr
S545
yoaW
S561
S1128
glgB
0.98
0.77
0.75
0.75
0.75
0.75
0.74
0.74
0.74
0.74
Most Negatively Correlated Segments
purT
yxkC
yabN
cheC
S1305
yvbX
cheB
fliY
rnhB
flhA
-0.76
-0.75
-0.75
-0.74
-0.74
-0.74
-0.73
-0.73
-0.73
-0.73
Expression Profile of Segment S1216
Show/Hide
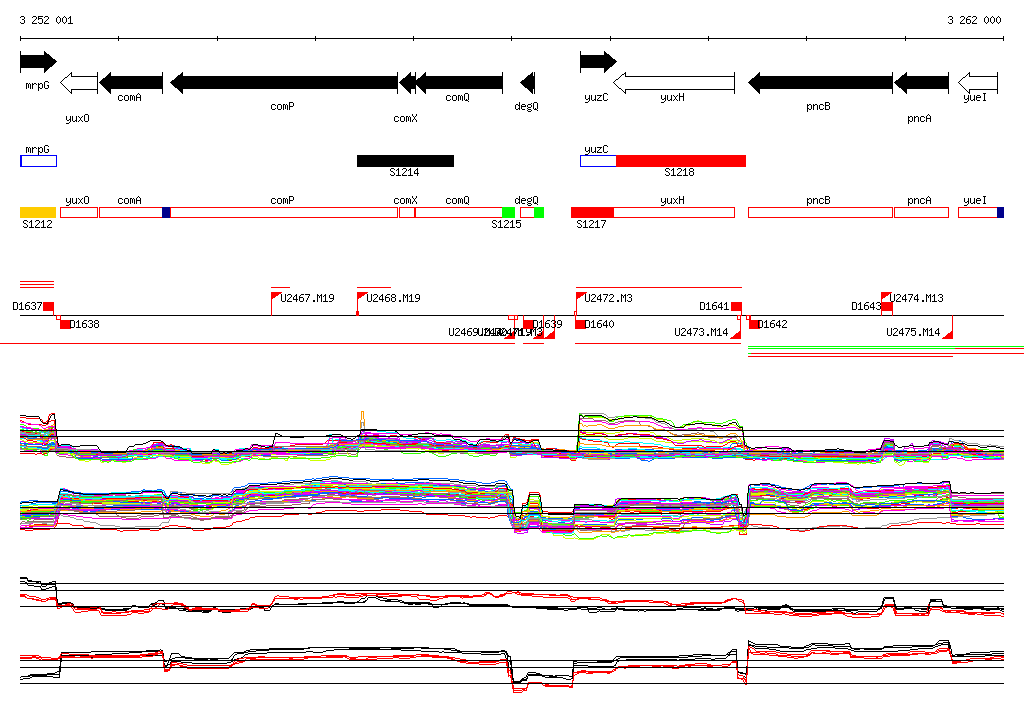
Genomic View of Gene/Segment S1216
Show/Hide
(Legend)
Browse Genome Context