| Start Page |
|
 |
| Start Page |
|
|
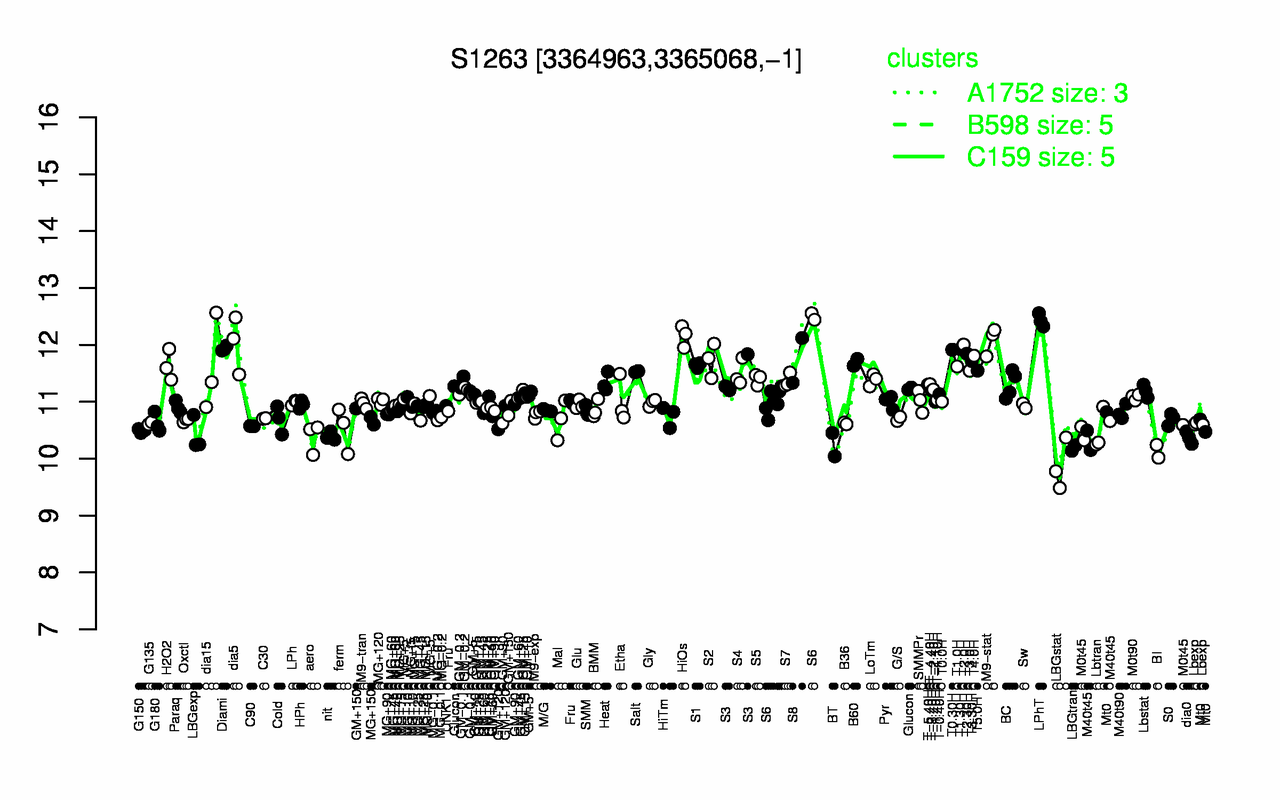
| LPhT | HiOs | M9-stat | dia5 | T2.0H | Diami | T1.30H | T0.30H | T2.30H | T4.0H |
| 12.4 | 12.2 | 12.1 | 12 | 12 | 11.9 | 11.9 | 11.9 | 11.8 | 11.8 |
| LBGstat | BI | LBGtran | BT | dia0 | aero | nit | LBGexp | M40t45 | Lbtran |
| 9.88 | 10.1 | 10.2 | 10.2 | 10.4 | 10.4 | 10.4 | 10.4 | 10.4 | 10.5 |