| Start Page |
|
 |
| Start Page |
|
|
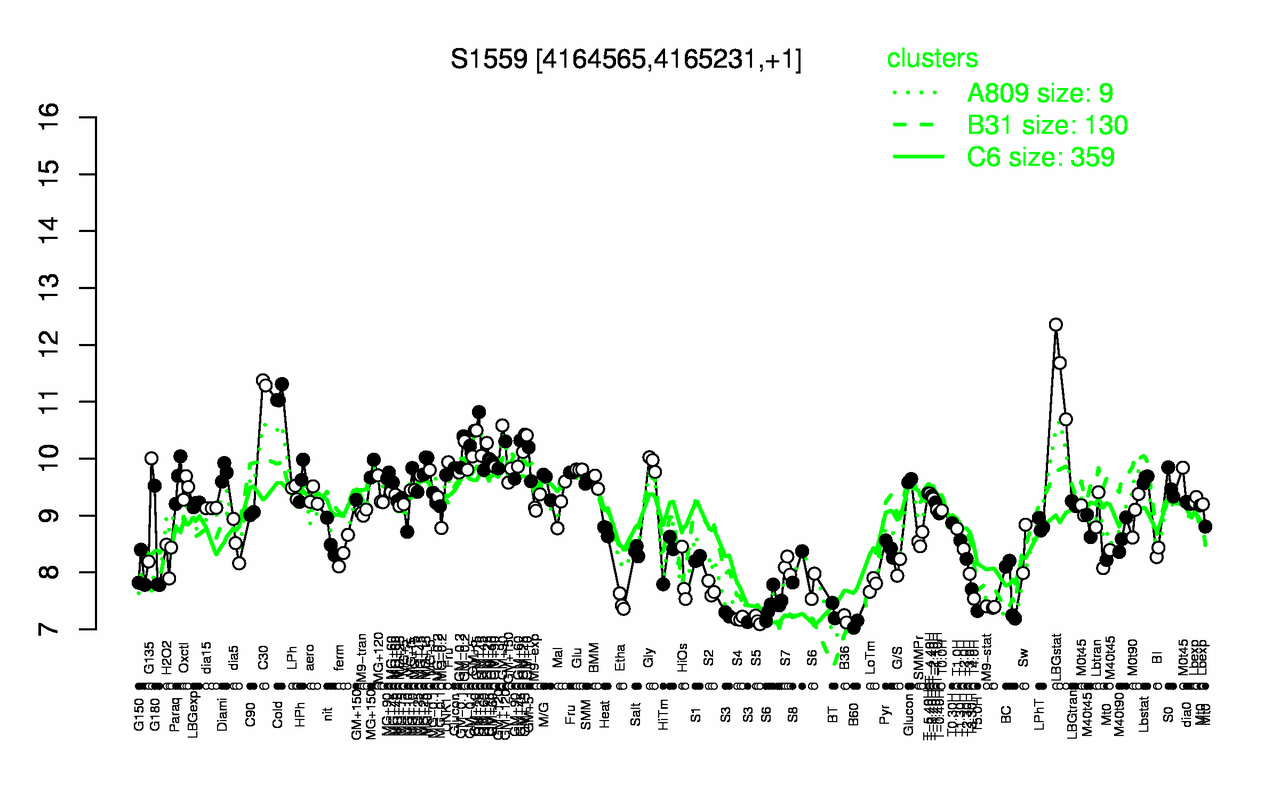
| LBGstat | C30 | Cold | GM+10 | GM+25 | GM+15 | GM-0.1 | GM+45 | GM+120 | GM+90 |
| 11.6 | 11.3 | 11.1 | 10.5 | 10.4 | 10.3 | 10.2 | 10.1 | 10.1 | 10 |
| B60 | S5 | B36 | S4 | S3 | T5.0H | BT | M9-stat | Etha | S6 |
| 7.09 | 7.16 | 7.18 | 7.19 | 7.22 | 7.32 | 7.33 | 7.39 | 7.47 | 7.51 |