| Start Page |
|
 |
| Start Page |
|
|
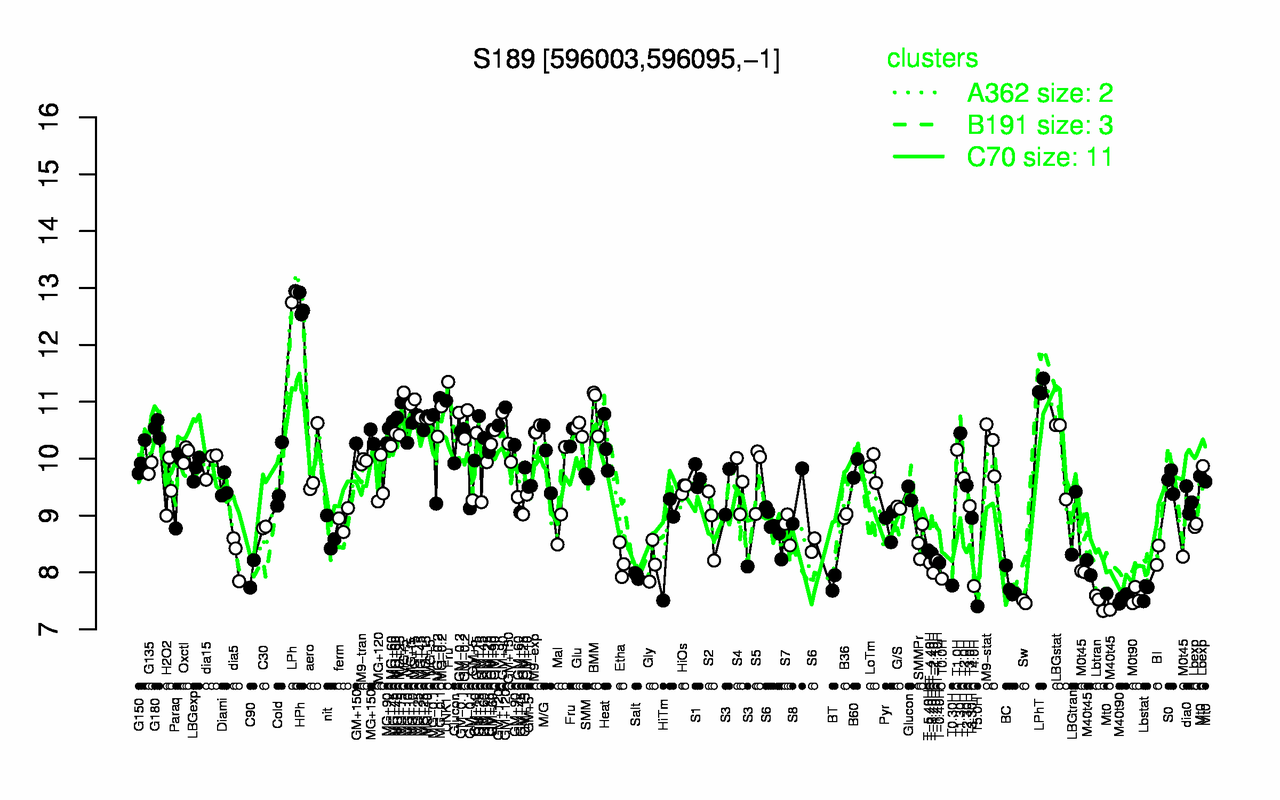
| LPh | HPh | LPhT | UNK1 | MG+t5 | MG+5 | MG+15 | BMM | GM+120 | Fru |
| 12.9 | 12.7 | 11.2 | 11 | 11 | 10.9 | 10.9 | 10.9 | 10.7 | 10.7 |
| T5.0H | Lbtran | Sw | M40t90 | M0t90 | Lbstat | T4.0H | BC | T0.30H | BT |
| 7.4 | 7.48 | 7.49 | 7.54 | 7.57 | 7.67 | 7.76 | 7.77 | 7.77 | 7.82 |