| Start Page |
|
 |
| Start Page |
|
|
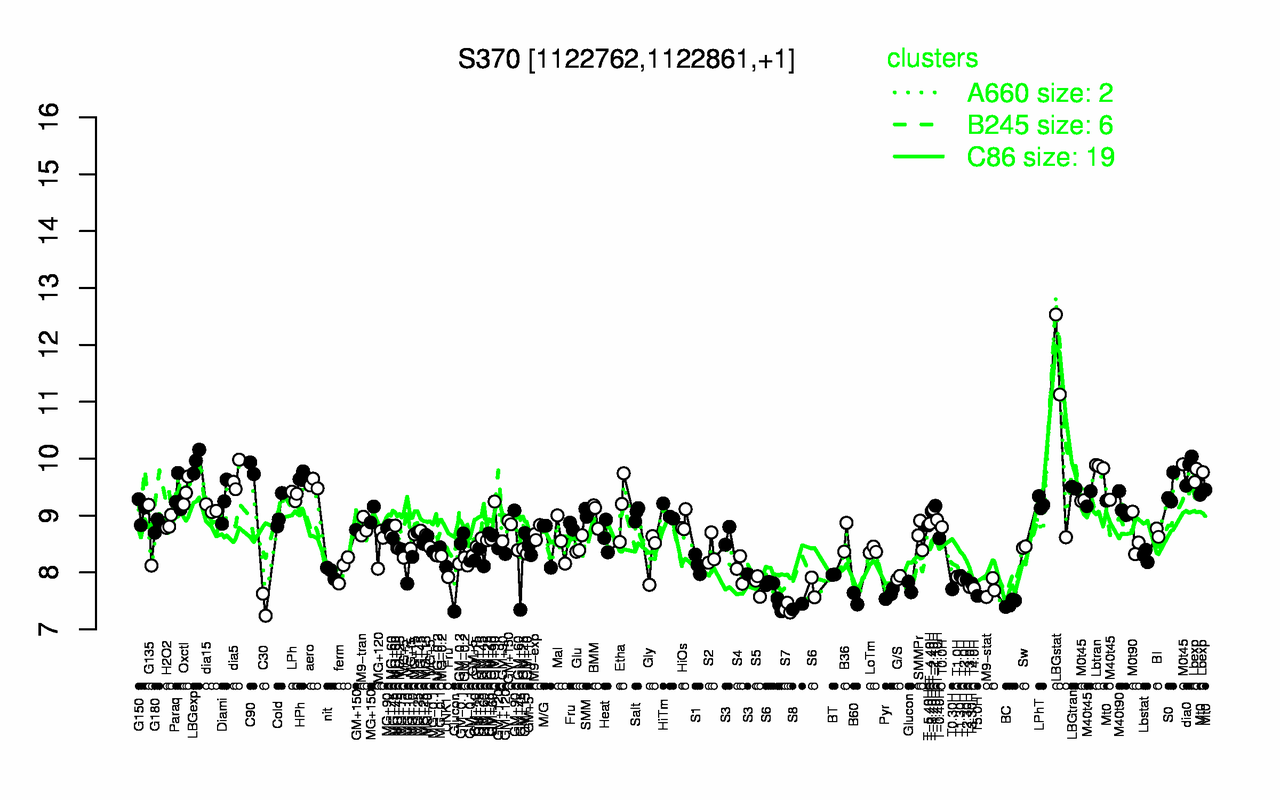
| LBGstat | LBGexp | Lbtran | C90 | dia0 | Lbexp | HPh | dia5 | aero | LBGtran |
| 10.8 | 9.95 | 9.86 | 9.83 | 9.82 | 9.72 | 9.68 | 9.68 | 9.55 | 9.49 |
| S7 | S8 | C30 | BC | B60 | T5.0H | Glucon | Pyr | S6 | T0.30H |
| 7.37 | 7.4 | 7.43 | 7.46 | 7.54 | 7.59 | 7.6 | 7.63 | 7.67 | 7.71 |