B. subtilis Expression Data Browser
Start Page
B. subtilis Expression Data Browser
Gene/Segment:
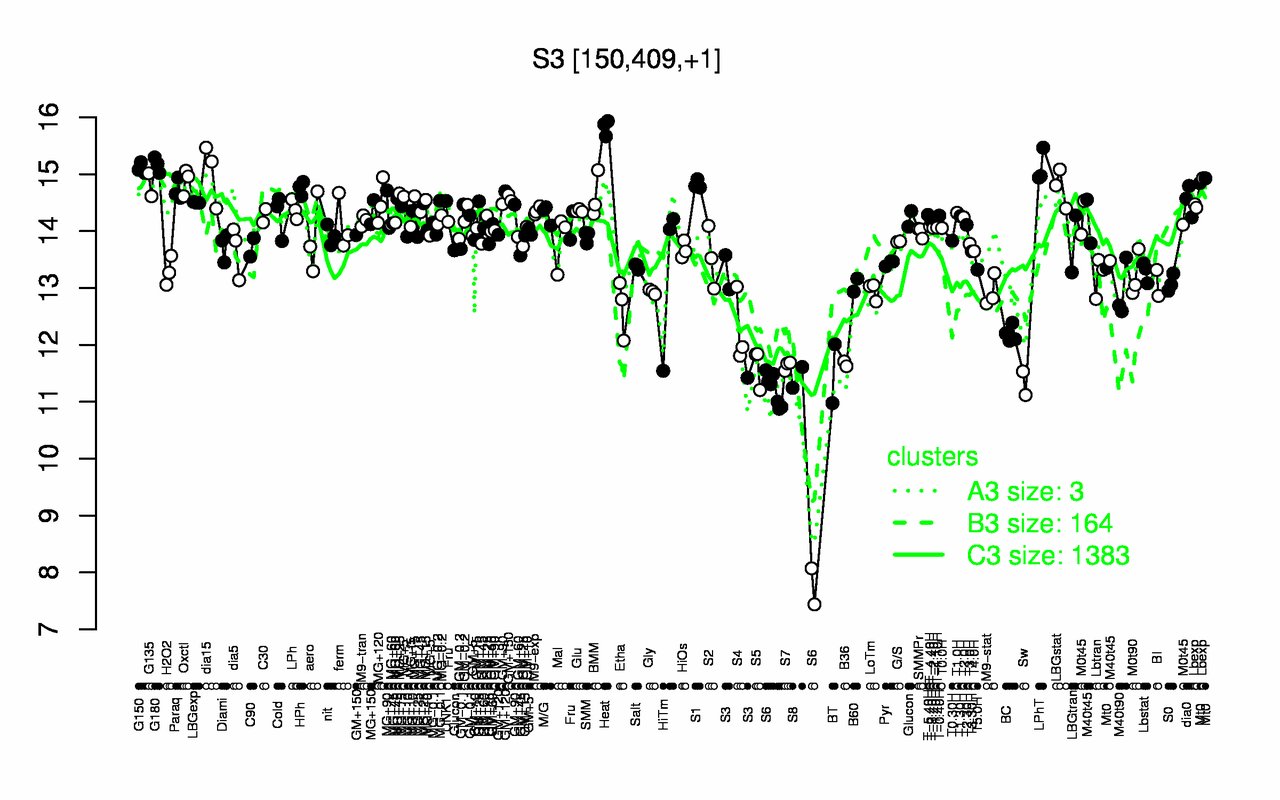
S3
Locus Tag:
new_150_409
Details about S3
Show/Hide
Highest Expression Conditions
Heat
G180
LPhT
G150
dia15
Oxctl
S1
G135
LBGstat
HPh
15.8
15.2
15.1
15.1
15
14.9
14.8
14.8
14.8
14.8
Lowest Expression Conditions
S6
Sw
S8
BT
S5
S7
B36
BC
S4
Etha
10.4
11.3
11.4
11.5
11.6
11.6
11.7
12.2
12.3
12.7
Most Positively Correlated Segments
dnaA
S5
S921
S581
S1069
S250
S50
tig
S10
S7
0.92
0.86
0.85
0.85
0.84
0.84
0.84
0.83
0.82
0.82
Most Negatively Correlated Segments
yngI
yngE
ybbC
yngF
yngG
yojJ
yhzD
yycQ
S402
yngHA
-0.78
-0.78
-0.77
-0.77
-0.77
-0.77
-0.77
-0.76
-0.76
-0.76
Expression Profile of Segment S3
Show/Hide
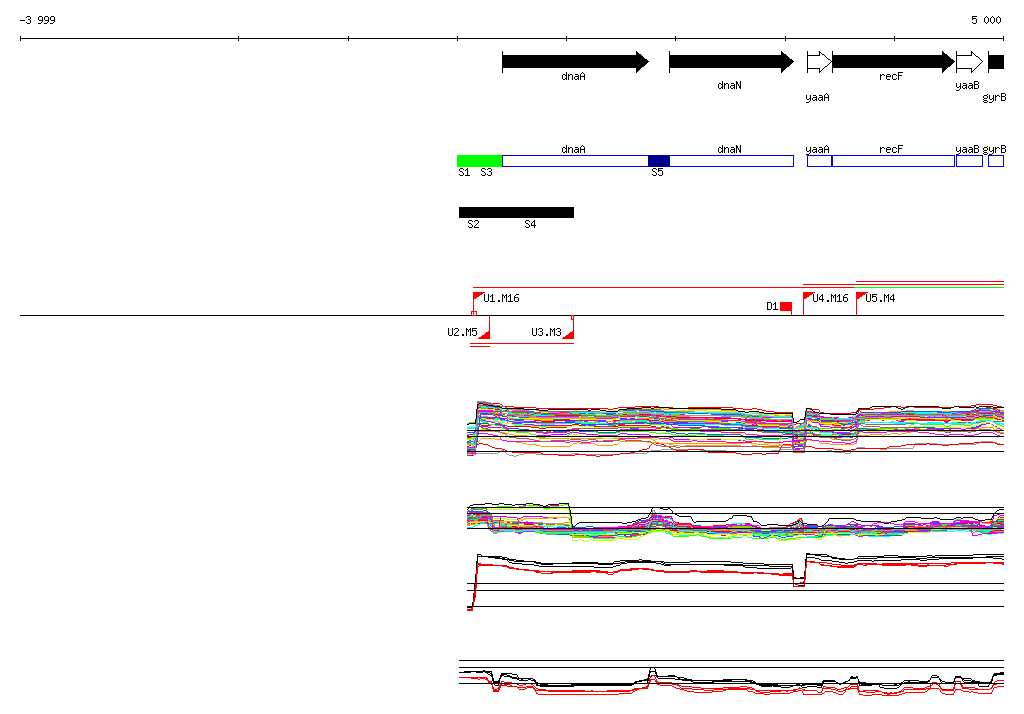
Genomic View of Gene/Segment S3
Show/Hide
(Legend)
Browse Genome Context