| Start Page |
|
 |
| Start Page |
|
|
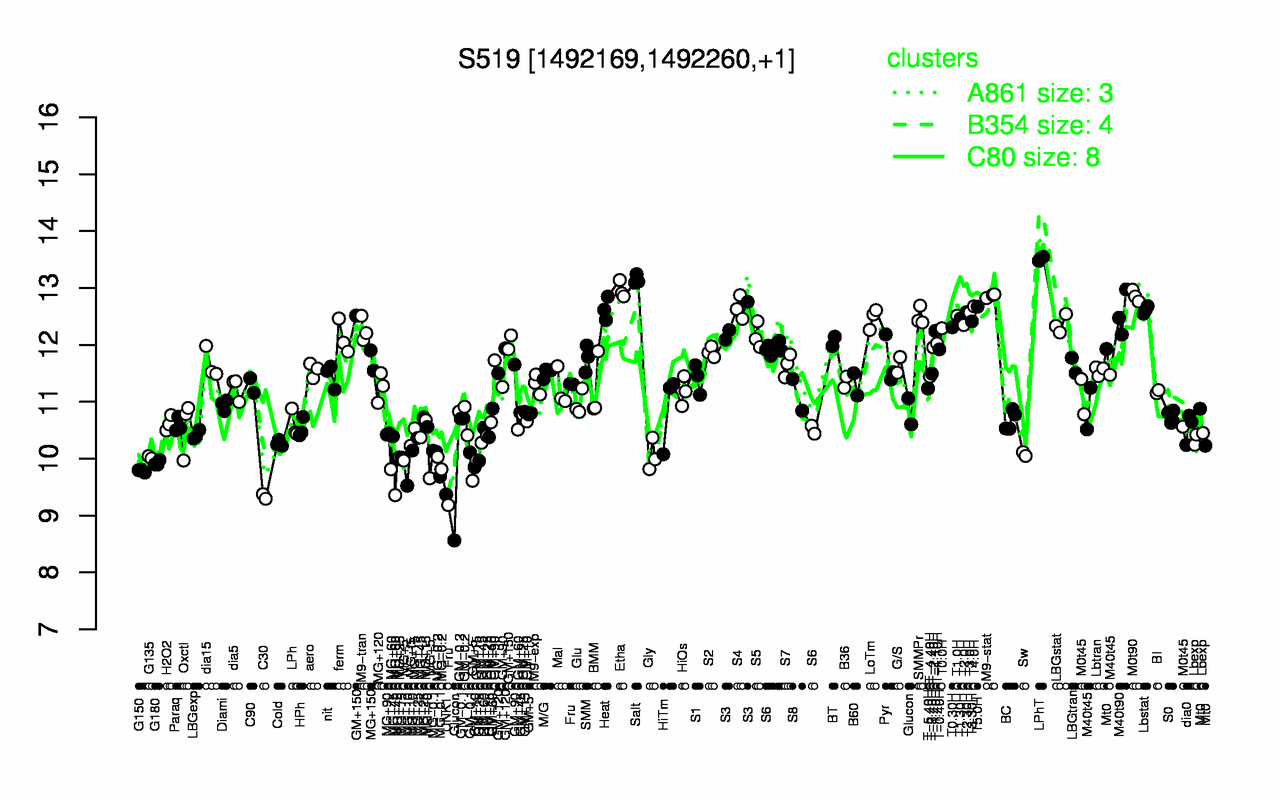
| LPhT | Salt | Etha | M9-stat | M0t90 | T4.0H | T5.0H | S4 | Heat | Lbstat |
| 13.5 | 13.1 | 13 | 12.9 | 12.9 | 12.7 | 12.7 | 12.7 | 12.6 | 12.6 |
| C30 | UNK1 | MG+60 | G150 | MG+5 | MG-0.2 | G180 | MG-0.1 | G135 | Gly |
| 9.34 | 9.37 | 9.59 | 9.79 | 9.81 | 9.92 | 9.92 | 9.98 | 10 | 10.1 |