B. subtilis Expression Data Browser
Details about S51 Show/Hide
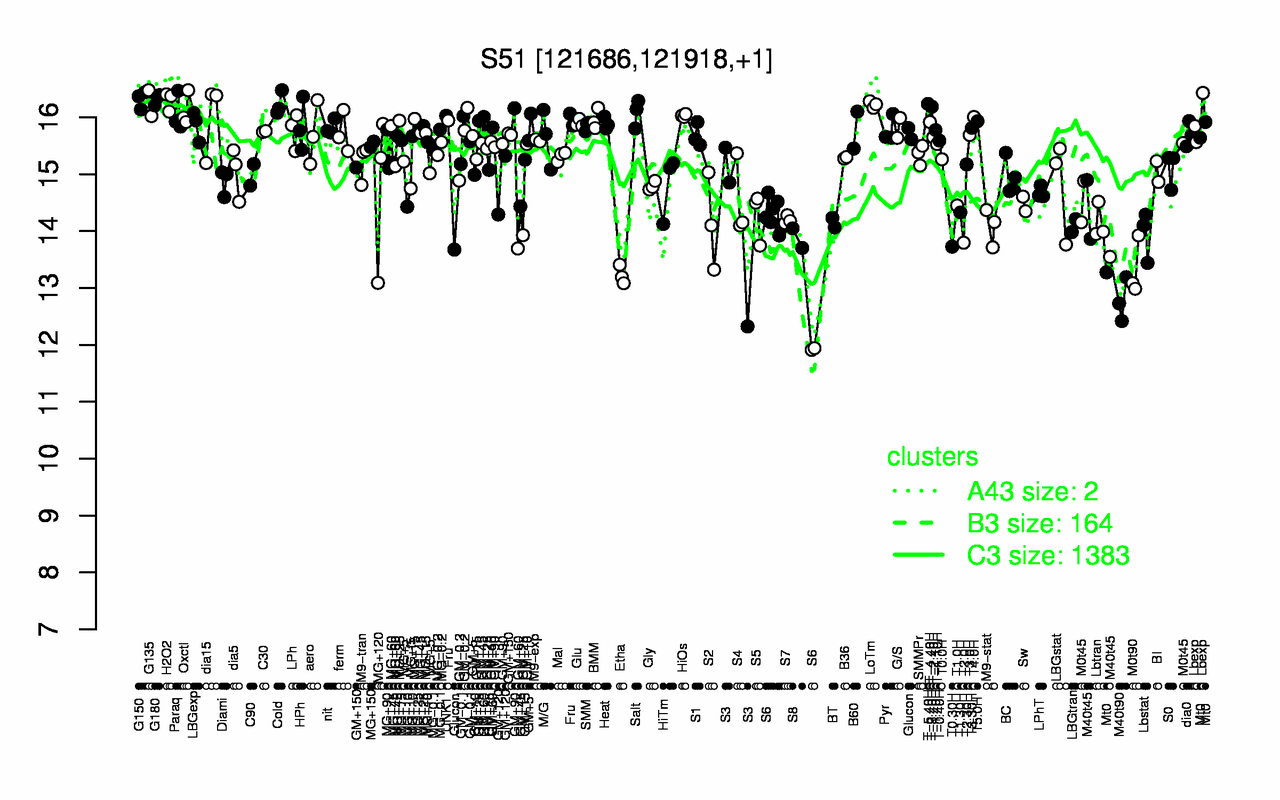
Highest Expression Conditions
G180 G150 H2O2 G135 Cold T-5.40H LoTm T-3.40H Oxctl Salt
16.3 16.3 16.3 16.2 16.2 16.2 16.2 16.2 16.1 16.1
Lowest Expression Conditions
M40t90 Etha M0t90 T0.30H S6 T2.0H S8 Lbstat M9-stat LBGtran
12.8 13.2 13.3 13.7 13.8 13.8 13.9 13.9 14.1 14.1
Most Positively Correlated Segments
S48 S27 S593 S595 nusG S1581 S589 S1089 rpsJ S1059
0.84 0.82 0.81 0.79 0.78 0.77 0.77 0.77 0.76 0.76
Most Negatively Correlated Segments
phy yccK yqaC S1097 yugM yugN phoR S1195 yfmK yqhP
-0.71 -0.71 -0.7 -0.68 -0.67 -0.66 -0.64 -0.64 -0.64 -0.63
Expression Profile of Segment S51 Show/Hide
Genomic View of Gene/Segment S51 Show/Hide
(Legend)