| Start Page |
|
 |
| Start Page |
|
|
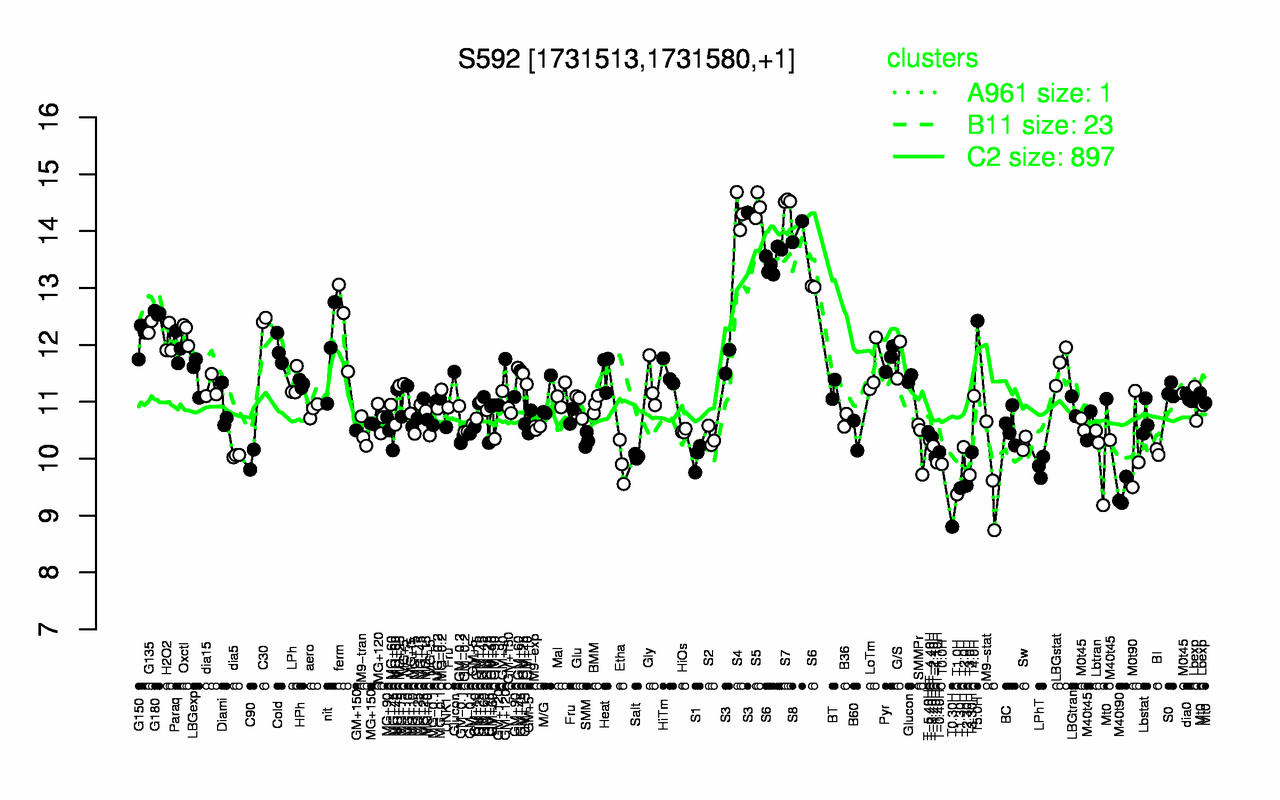
| S7 | S5 | S4 | S8 | S6 | S3 | G180 | C30 | T5.0H | ferm |
| 14.5 | 14.4 | 14.3 | 14 | 13.4 | 12.6 | 12.6 | 12.4 | 12.4 | 12.4 |
| T0.30H | T1.0H | M40t90 | T1.30H | T2.30H | M9-stat | T3.0H | LPhT | T0.0H | Etha |
| 8.8 | 9.37 | 9.39 | 9.48 | 9.53 | 9.67 | 9.71 | 9.86 | 9.9 | 9.93 |