| Start Page |
|
 |
| Start Page |
|
|
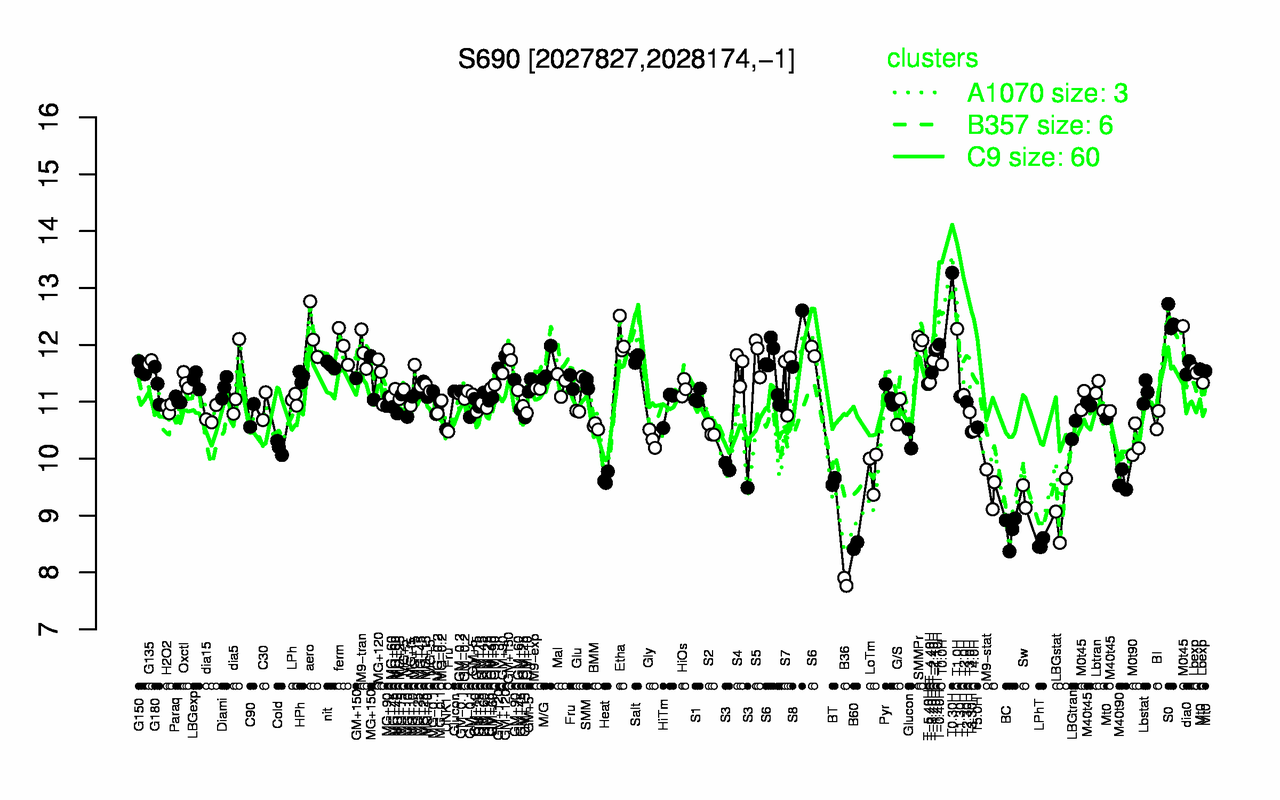
| T0.30H | S0 | T1.0H | aero | Etha | S8 | SMMPr | T-0.40H | ferm | T-1.10H |
| 13.3 | 12.5 | 12.3 | 12.2 | 12.1 | 12.1 | 12.1 | 12 | 12 | 12 |
| B36 | B60 | LPhT | BC | LBGstat | Sw | M9-stat | BT | M40t90 | Heat |
| 7.84 | 8.47 | 8.5 | 8.75 | 9.08 | 9.33 | 9.5 | 9.6 | 9.6 | 9.65 |