| Start Page |
|
 |
| Start Page |
|
|
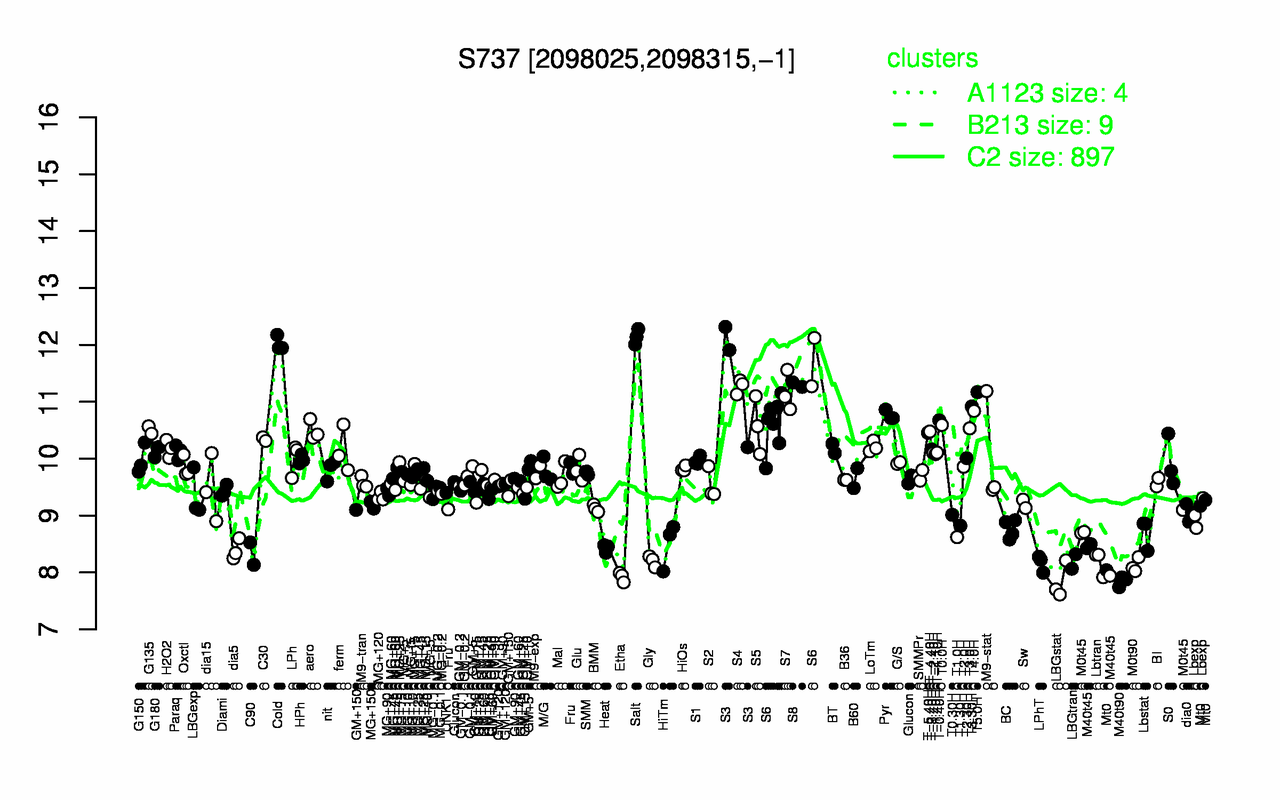
| Salt | Cold | S3 | S8 | S4 | S7 | T5.0H | T3.30H | S6 | T4.0H |
| 12.1 | 12 | 11.5 | 11.3 | 11.3 | 11.2 | 11.2 | 10.9 | 10.9 | 10.8 |
| LBGstat | M40t90 | Etha | M0t90 | LPhT | Lbtran | LBGtran | Gly | M40t45 | C90 |
| 7.84 | 7.84 | 7.92 | 8.12 | 8.16 | 8.18 | 8.19 | 8.2 | 8.29 | 8.33 |