| Start Page |
|
 |
| Start Page |
|
|
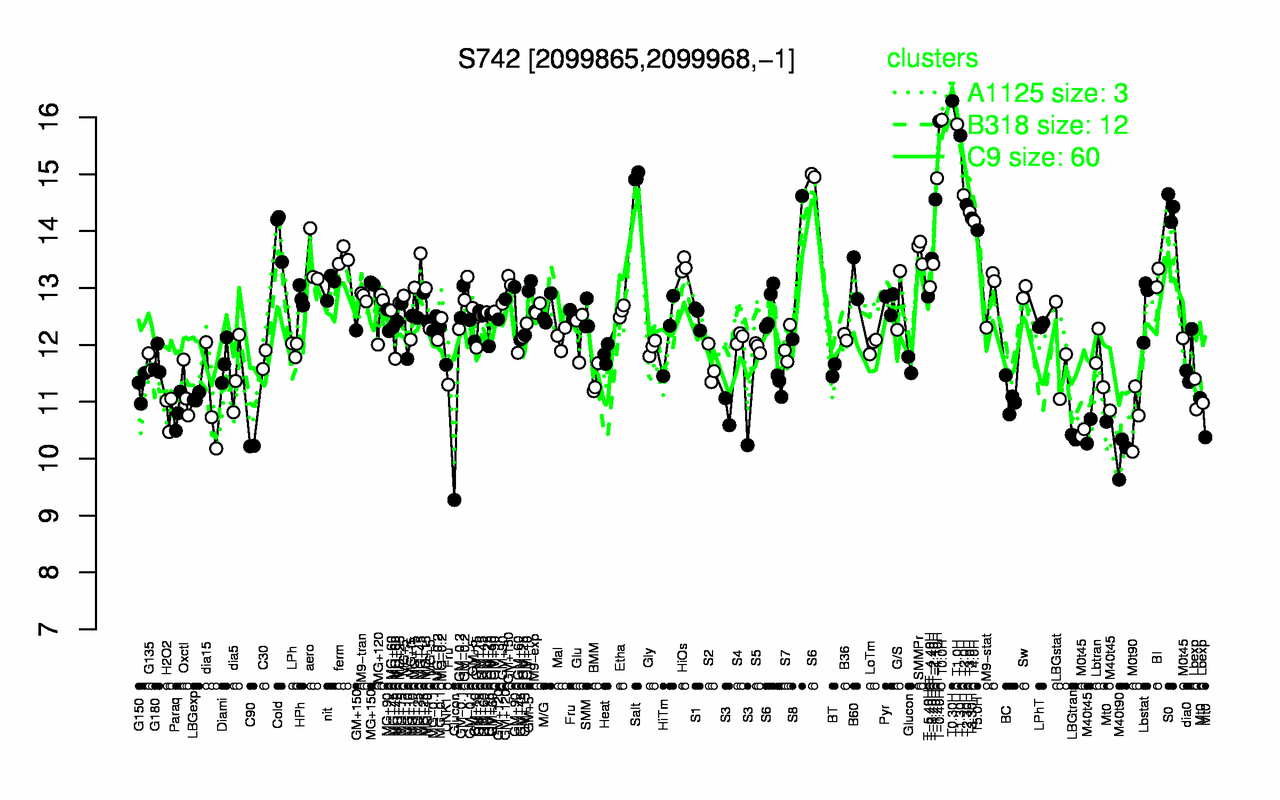
| T0.30H | T0.0H | T-0.40H | T1.0H | T1.30H | Salt | T-1.10H | T2.0H | T-1.40H | T2.30H |
| 16.3 | 16 | 15.9 | 15.9 | 15.7 | 15 | 14.9 | 14.6 | 14.6 | 14.5 |
| M40t90 | C90 | LBGtran | M40t45 | S3 | Mt0 | M0t90 | Paraq | H2O2 | Glucon |
| 10.1 | 10.2 | 10.4 | 10.6 | 10.6 | 10.7 | 10.7 | 10.8 | 10.8 | 10.9 |