B. subtilis Expression Data Browser
Start Page
B. subtilis Expression Data Browser
Gene/Segment:
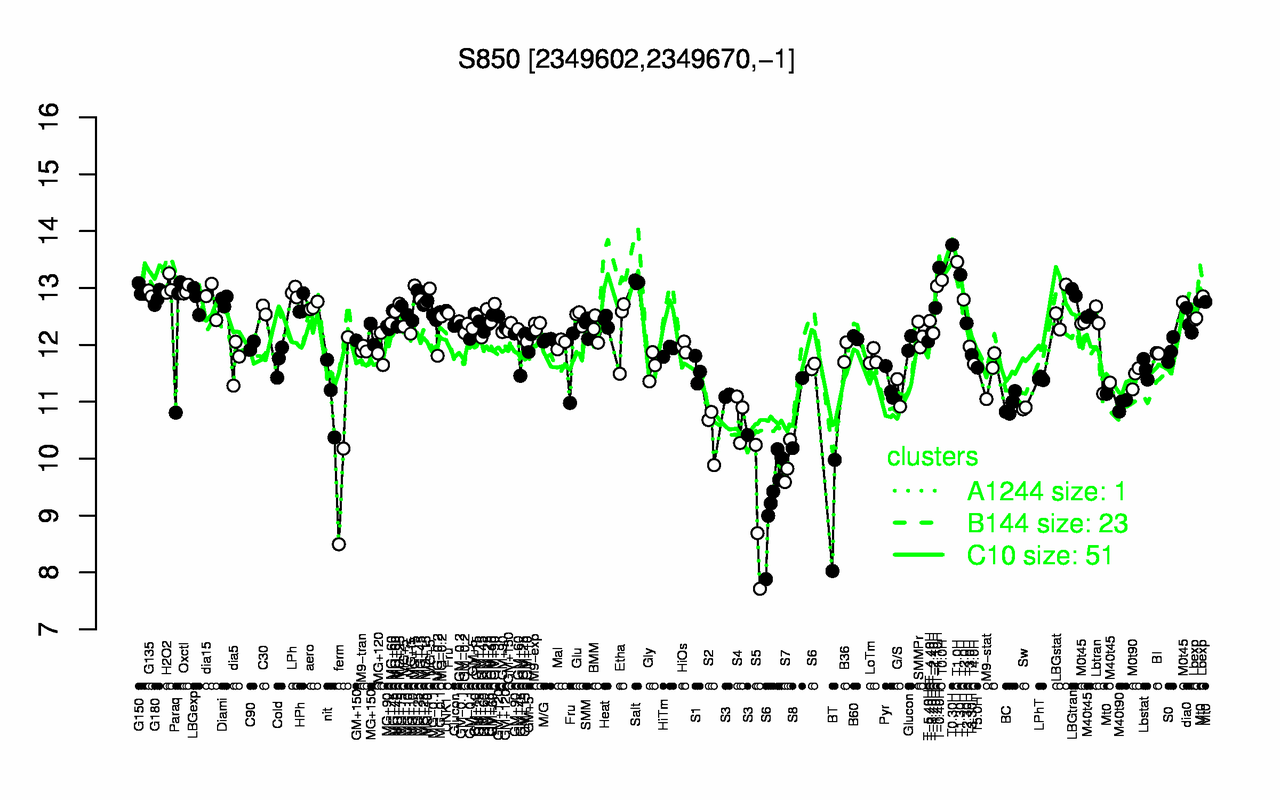
S850
Locus Tag:
new_2349602_2349670_c
Details about S850
Show/Hide
Highest Expression Conditions
T0.30H
T1.0H
T-0.40H
T1.30H
T0.0H
Salt
H2O2
T-1.10H
Oxctl
G150
13.8
13.5
13.4
13.2
13.1
13.1
13
13
13
13
Lowest Expression Conditions
S5
BT
S6
S7
ferm
S2
S4
S8
S3
Sw
8.88
9
9.84
9.92
10.3
10.5
10.8
10.8
10.9
10.9
Most Positively Correlated Segments
ypmA
S848
S1480
mobA
dinG
dltD
ywzH
dltC
S298
asnB
0.81
0.78
0.76
0.76
0.76
0.76
0.76
0.75
0.75
0.75
Most Negatively Correlated Segments
ypzI
S545
phrC
S865
ylaJ
spoVAA
yvaM
spoVAC
spoVAD
yraD
-0.76
-0.75
-0.75
-0.75
-0.75
-0.75
-0.74
-0.74
-0.74
-0.73
Expression Profile of Segment S850
Show/Hide
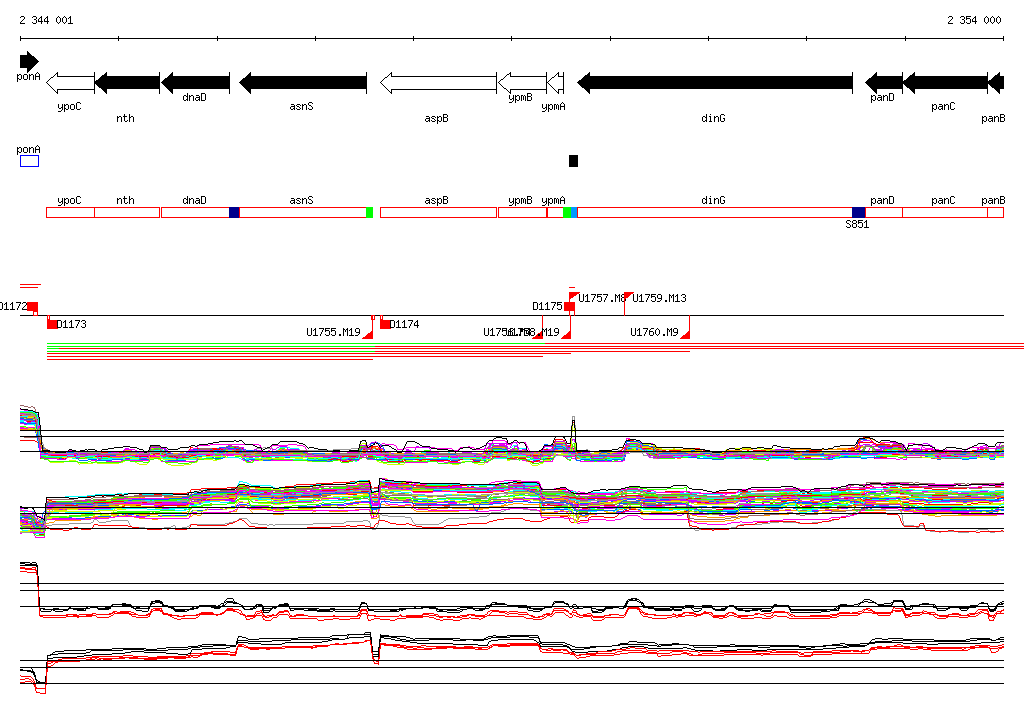
Genomic View of Gene/Segment S850
Show/Hide
(Legend)
Browse Genome Context