| Start Page |
|
 |
| Start Page |
|
|
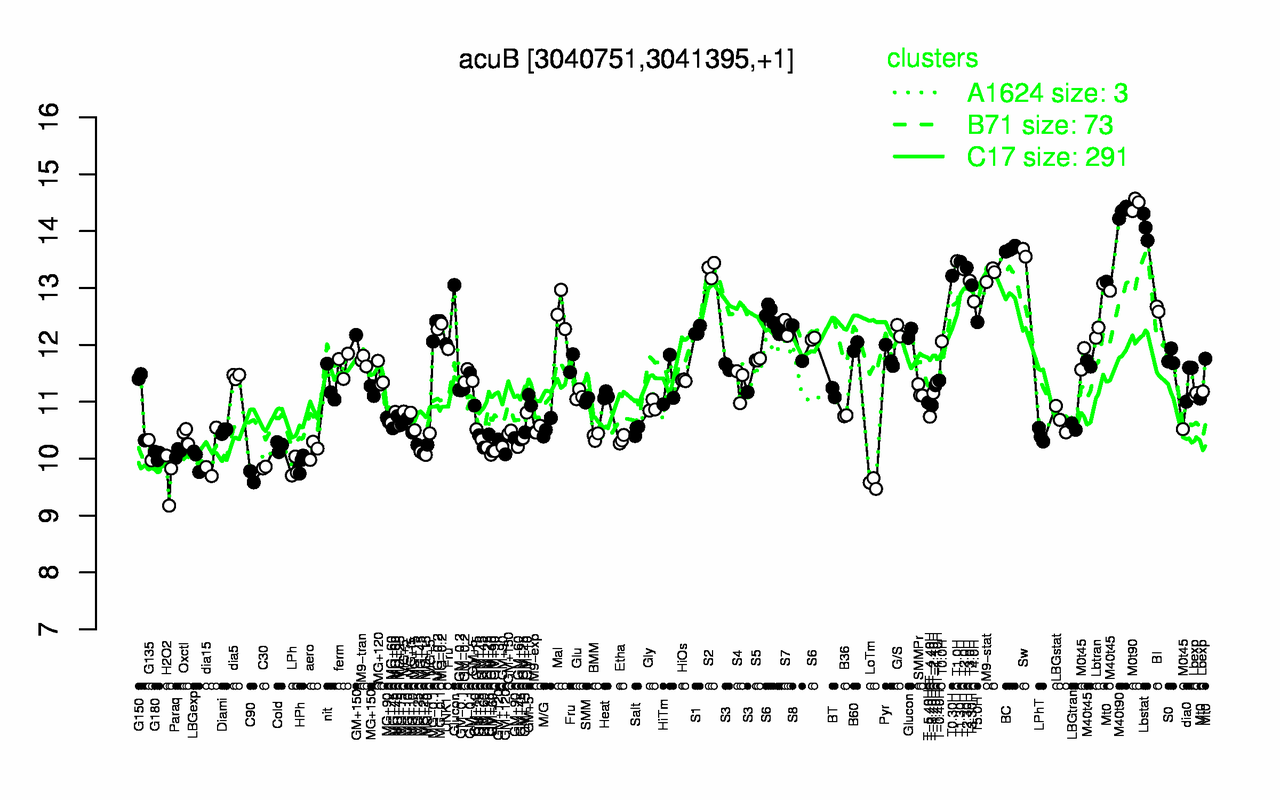
| M0t90 | M40t90 | Lbstat | BC | Sw | T1.0H | T1.30H | T2.30H | T2.0H | S2 |
| 14.5 | 14.3 | 14.1 | 13.7 | 13.6 | 13.5 | 13.5 | 13.4 | 13.3 | 13.3 |
| LoTm | C90 | H2O2 | LPh | C30 | HPh | LBGexp | dia15 | G180 | Paraq |
| 9.57 | 9.68 | 9.69 | 9.83 | 9.84 | 9.92 | 9.99 | 10 | 10.1 | 10.1 |