| Start Page |
|
 |
| Start Page |
|
|
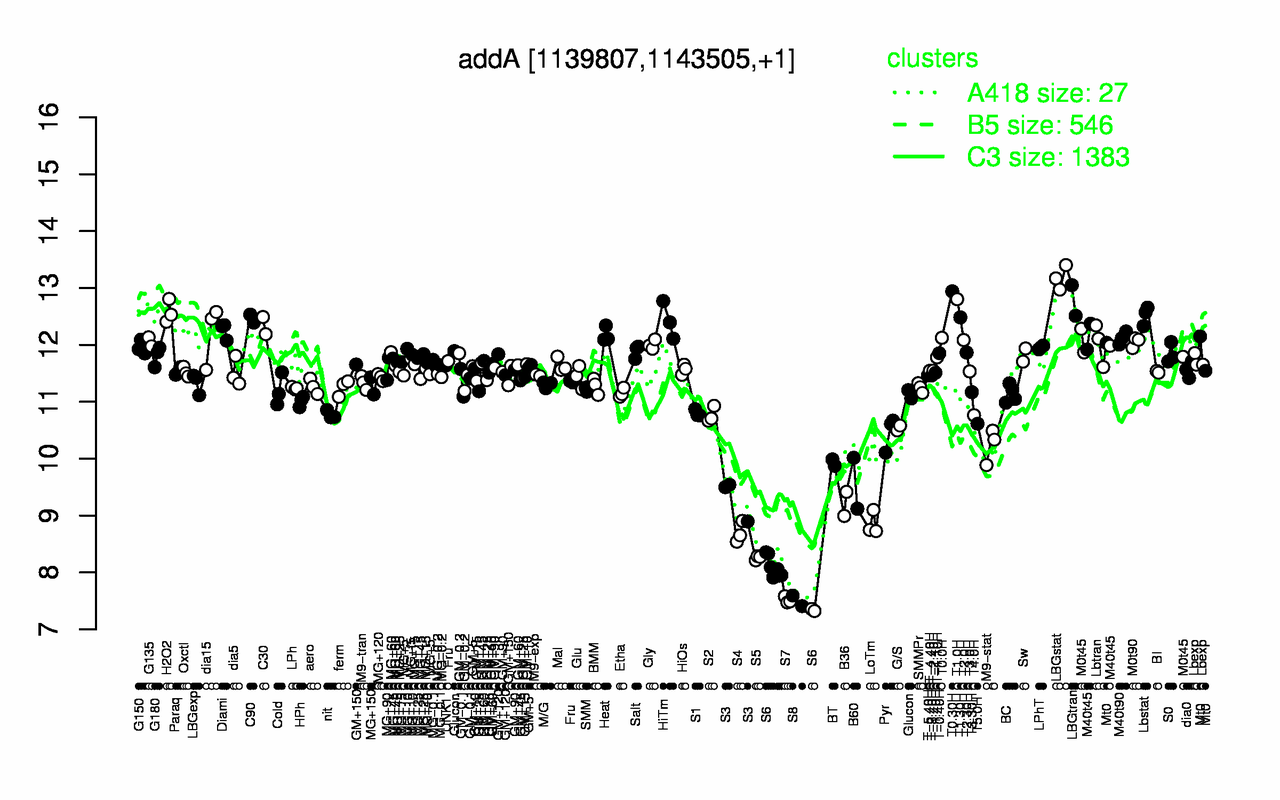
| LBGstat | T0.30H | T1.0H | LBGtran | H2O2 | Lbstat | T1.30H | C90 | HiTm | C30 |
| 13.2 | 12.9 | 12.8 | 12.8 | 12.6 | 12.5 | 12.5 | 12.5 | 12.4 | 12.3 |
| S8 | S7 | S6 | S5 | S4 | LoTm | B36 | S3 | B60 | BT |
| 7.5 | 7.52 | 7.92 | 8.26 | 8.7 | 8.86 | 9.21 | 9.31 | 9.57 | 9.93 |