| Start Page |
|
 |
| Start Page |
|
|
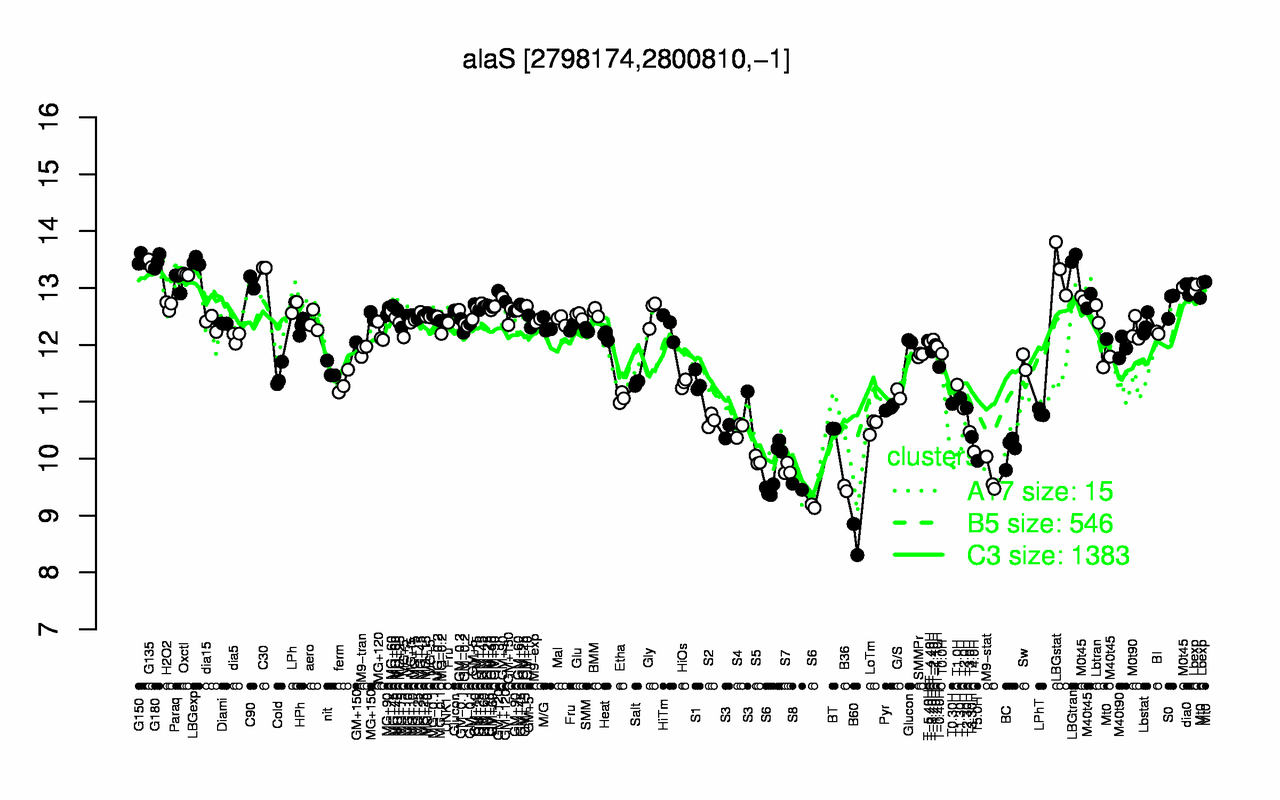
| LBGtran | G150 | LBGexp | G180 | G135 | C30 | LBGstat | Oxctl | Paraq | C90 |
| 13.5 | 13.5 | 13.5 | 13.5 | 13.4 | 13.4 | 13.3 | 13.2 | 13.1 | 13.1 |
| B60 | B36 | S8 | S6 | M9-stat | S7 | T5.0H | S5 | T4.0H | BC |
| 8.58 | 9.48 | 9.51 | 9.64 | 9.69 | 9.81 | 9.96 | 9.97 | 10.1 | 10.2 |