| Start Page |
|
 |
| Start Page |
|
|
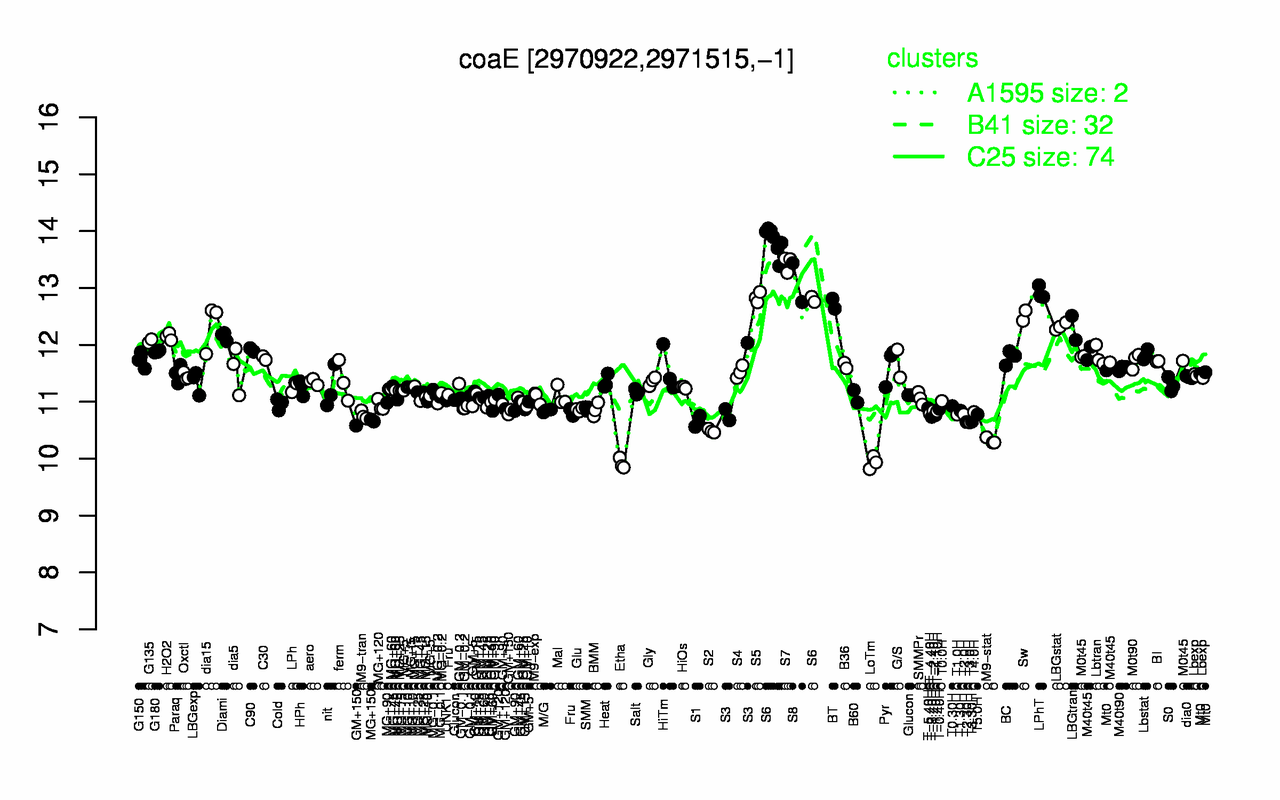
| S6 | S7 | S8 | LPhT | S5 | BT | Sw | dia15 | LBGstat | LBGtran |
| 13.6 | 13.4 | 13.1 | 12.9 | 12.8 | 12.7 | 12.5 | 12.3 | 12.3 | 12.3 |
| Etha | LoTm | M9-stat | S2 | T3.0H | S1 | T2.30H | T3.30H | MG+150 | T-3.40H |
| 9.91 | 9.93 | 10.3 | 10.5 | 10.6 | 10.6 | 10.6 | 10.7 | 10.7 | 10.7 |