B. subtilis Expression Data Browser
Start Page
B. subtilis Expression Data Browser
Gene/Segment:
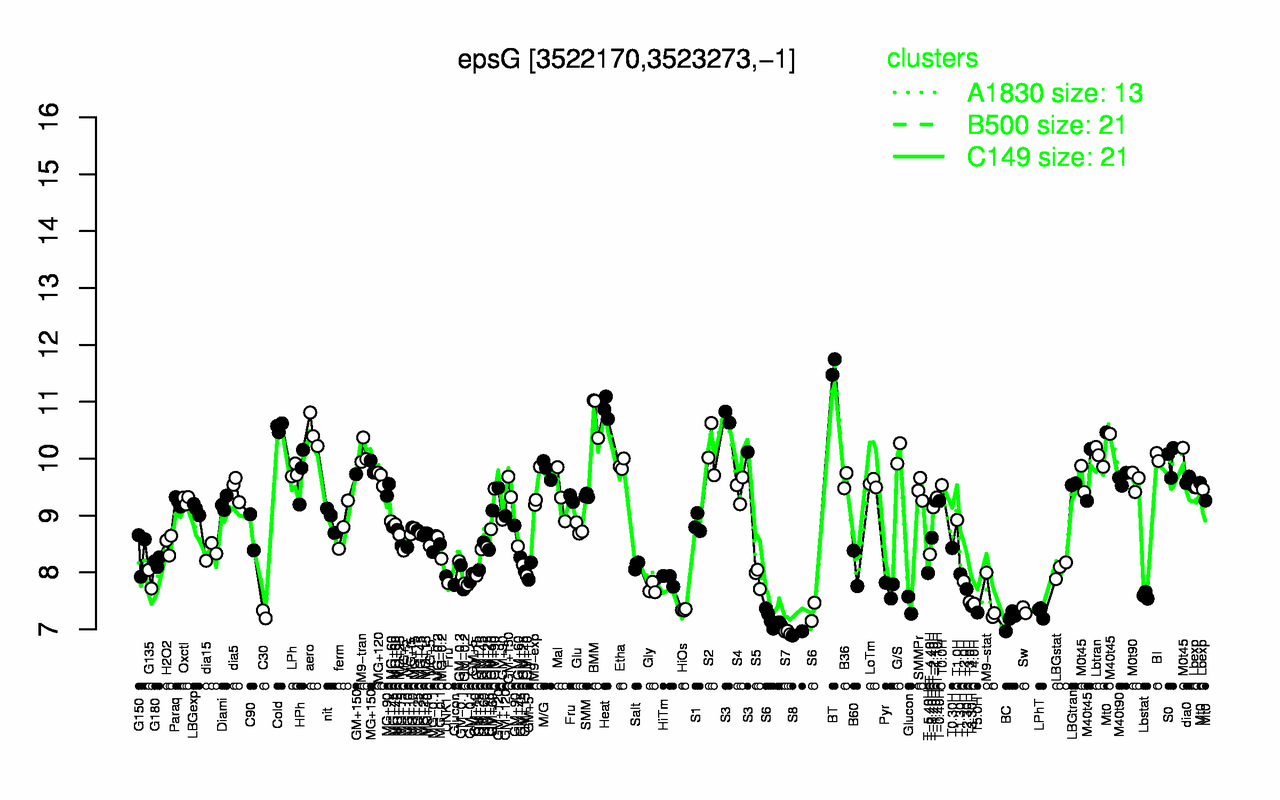
epsG
Locus Tag:
BSU34310
Details about epsG
Show/Hide
Highest Expression Conditions
BT
Heat
BMM
Cold
S3
aero
S2
M9-tran
G/S
Lbtran
11.6
10.9
10.8
10.6
10.5
10.5
10.1
10.1
10.1
10
Lowest Expression Conditions
S8
S7
BC
S6
C30
T5.0H
LPhT
Sw
HiOs
T3.30H
6.93
6.95
7.18
7.19
7.26
7.3
7.3
7.34
7.34
7.41
Most Positively Correlated Segments
epsH
epsJ
epsK
epsI
epsF
epsL
epsE
epsN
epsM
epsD
0.99
0.99
0.99
0.99
0.98
0.98
0.97
0.96
0.96
0.95
Most Negatively Correlated Segments
yczG
S790
S18
S980
S1395
S17
scr
ypzK
S382
ywmA
-0.56
-0.54
-0.54
-0.53
-0.52
-0.52
-0.5
-0.46
-0.45
-0.45
Expression Profile of Segment epsG
Show/Hide
Annotation of Gene epsG
Show/Hide
function
16.5: Explore
inference
ab initio prediction:AMIGene:2.0
codon_start
1
product
biofilm extracellular matrix formation enzyme
transl_table
11
note
Evidence 1a: Function experimentally demonstrated in the studied strain; PubMedId: 15175311, 15661000, 15849754, 16850406; Product type pe: putative enzyme
db_xref
GI:2635944
protein_id
CAB15436.1
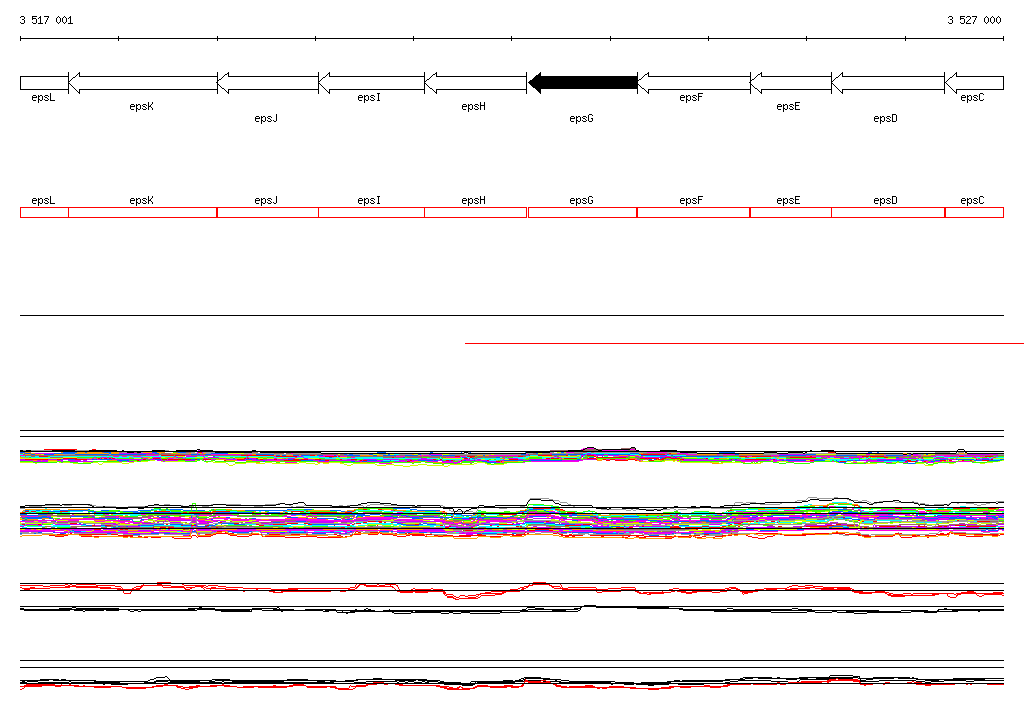
Genomic View of Gene/Segment epsG
Show/Hide
(Legend)
Browse Genome Context