| Start Page |
|
 |
| Start Page |
|
|
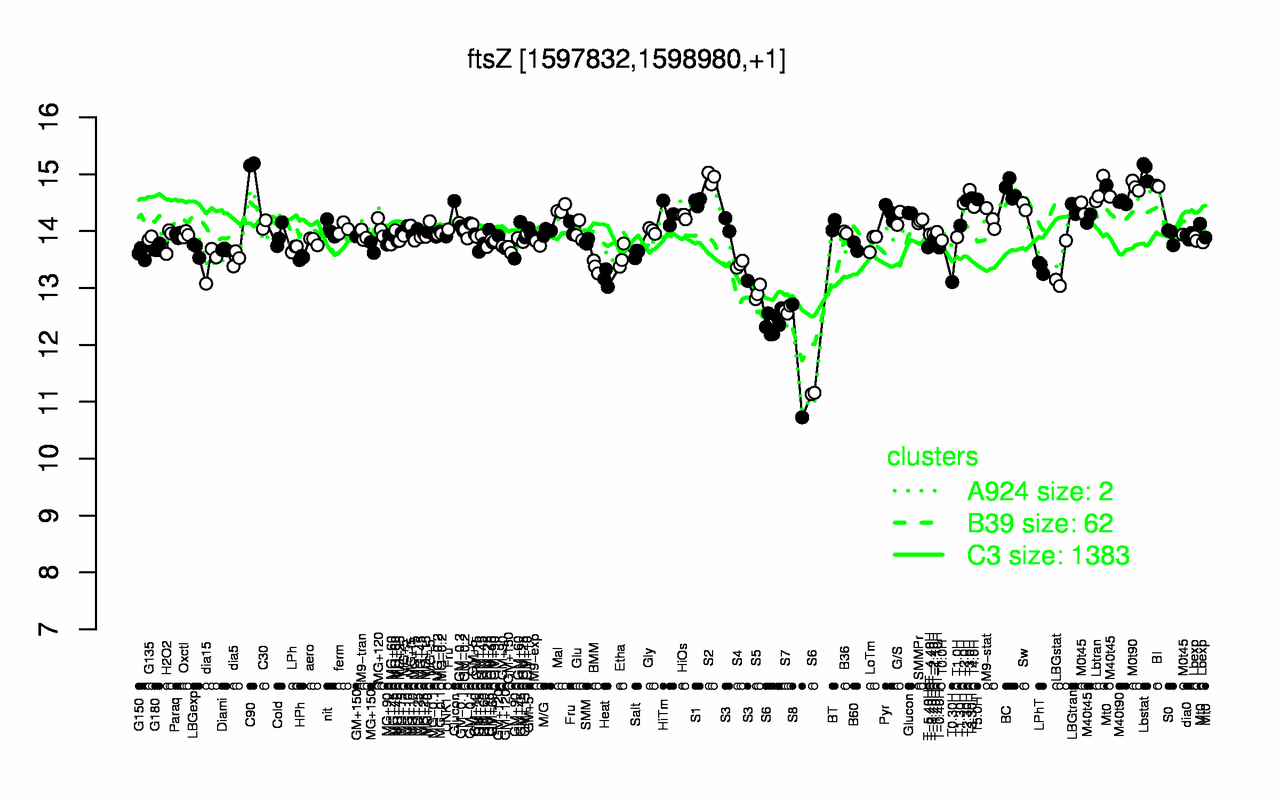
| C90 | Lbstat | S2 | M0t90 | BI | T3.0H | BC | Lbtran | T3.30H | T5.0H |
| 15.2 | 15.1 | 14.9 | 14.8 | 14.8 | 14.7 | 14.7 | 14.7 | 14.6 | 14.6 |
| S8 | S6 | S7 | S5 | T0.30H | Heat | LBGstat | LPhT | BMM | S4 |
| 11.7 | 12.1 | 12.6 | 12.9 | 13.1 | 13.2 | 13.3 | 13.4 | 13.4 | 13.4 |