B. subtilis Expression Data Browser
Start Page
B. subtilis Expression Data Browser
Gene/Segment:
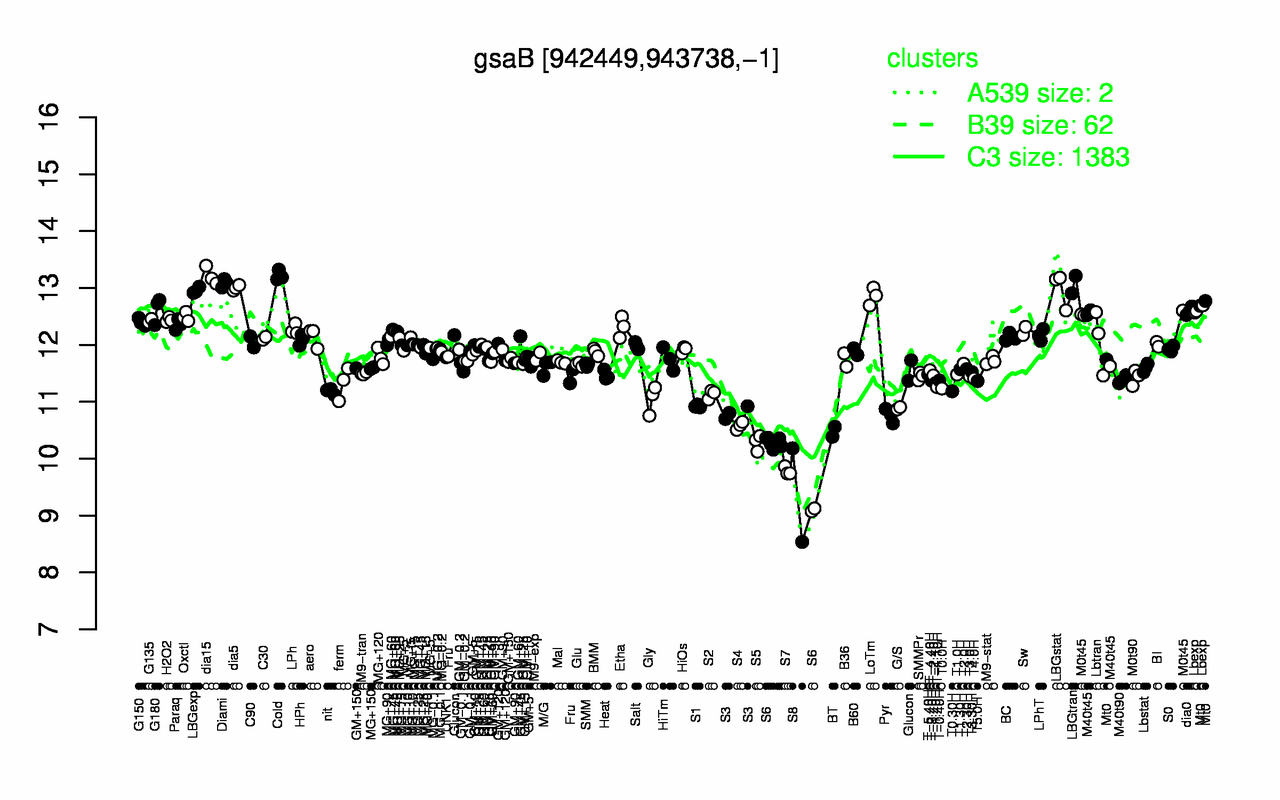
gsaB
Locus Tag:
BSU08710
Details about gsaB
Show/Hide
Highest Expression Conditions
Cold
dia15
Diami
LBGtran
dia5
LBGstat
LBGexp
LoTm
G180
Lbexp
13.2
13.2
13.1
13.1
13
13
13
12.9
12.6
12.6
Lowest Expression Conditions
S8
S7
S6
S5
BT
S4
Pyr
S3
G/S
S1
9.36
9.78
10
10.3
10.5
10.6
10.8
10.8
10.9
10.9
Most Positively Correlated Segments
S1080
walR
walK
ytkP
polX
ymdB
yloA
moeB
asnS
dgk
0.86
0.86
0.85
0.85
0.85
0.85
0.84
0.84
0.84
0.84
Most Negatively Correlated Segments
S651
yjzC
ybbF
ybbE
yvaM
yjbA
ybbC
ybbD
yhzD
ygzC
-0.78
-0.77
-0.77
-0.77
-0.76
-0.76
-0.76
-0.75
-0.75
-0.75
Expression Profile of Segment gsaB
Show/Hide
Annotation of Gene gsaB
Show/Hide
function
16.2: Construct biomass (Anabolism)
inference
ab initio prediction:AMIGene:2.0
codon_start
1
EC_number
5.4.3.8
transl_table
11
note
Evidence 2b: Function of strongly homologous gene; Product type e: enzyme
db_xref
GI:225184824
product
glutamate-1-semialdehyde aminotransferase, class III aminotransferase
protein_id
CAB12699.3
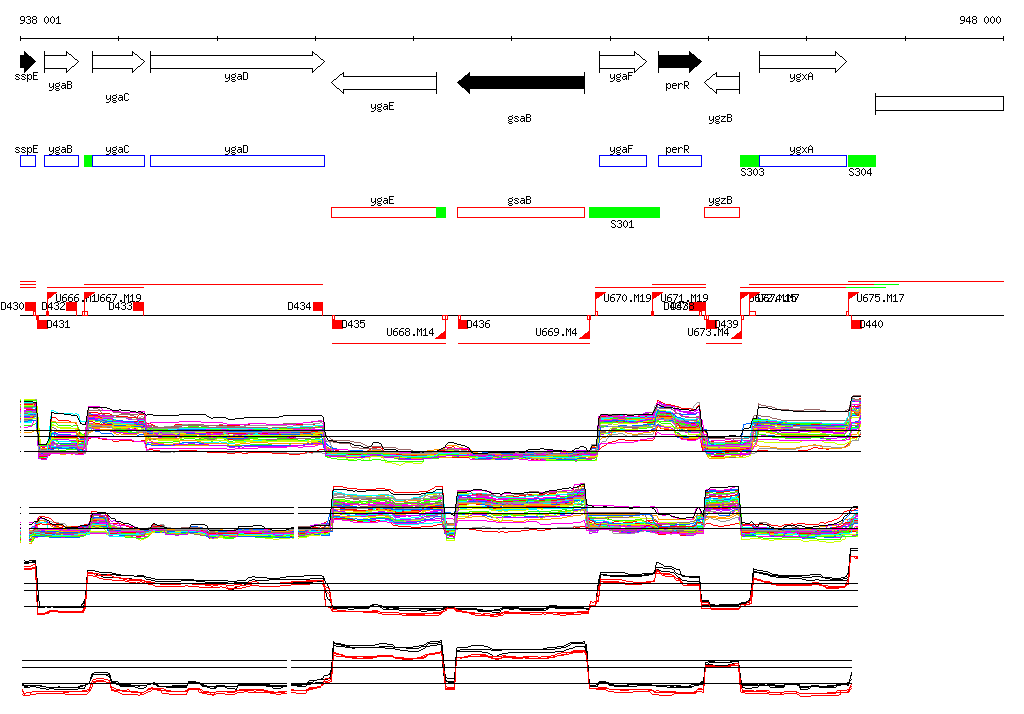
Genomic View of Gene/Segment gsaB
Show/Hide
(Legend)
Browse Genome Context