| Start Page |
|
 |
| Start Page |
|
|
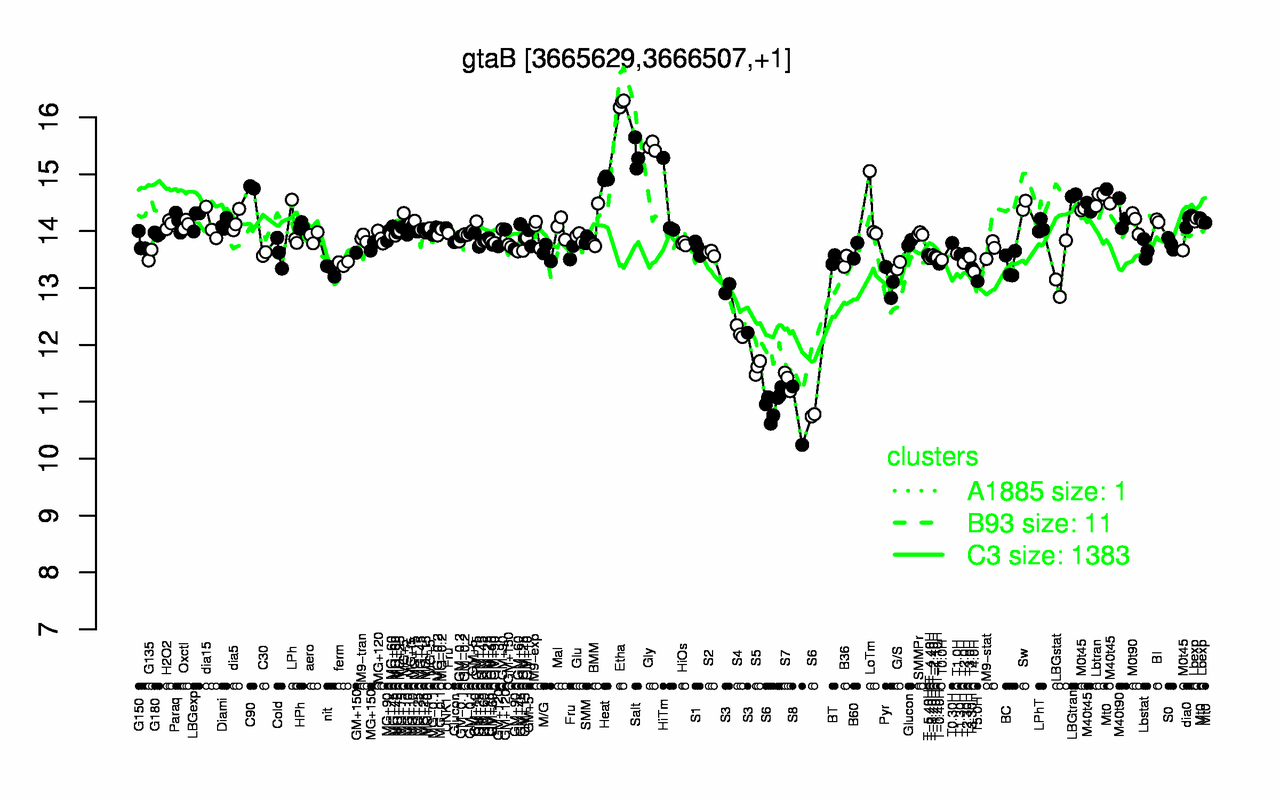
| Etha | Gly | Salt | Heat | C90 | LBGtran | Lbtran | HiTm | Sw | M40t45 |
| 16.2 | 15.5 | 15.3 | 14.9 | 14.8 | 14.6 | 14.6 | 14.5 | 14.5 | 14.4 |
| S8 | S6 | S7 | S5 | S4 | S3 | Pyr | T5.0H | LBGstat | T4.0H |
| 10.8 | 10.9 | 11.4 | 11.6 | 12.2 | 12.7 | 13.1 | 13.1 | 13.3 | 13.3 |