B. subtilis Expression Data Browser
Details about gyrA Show/Hide
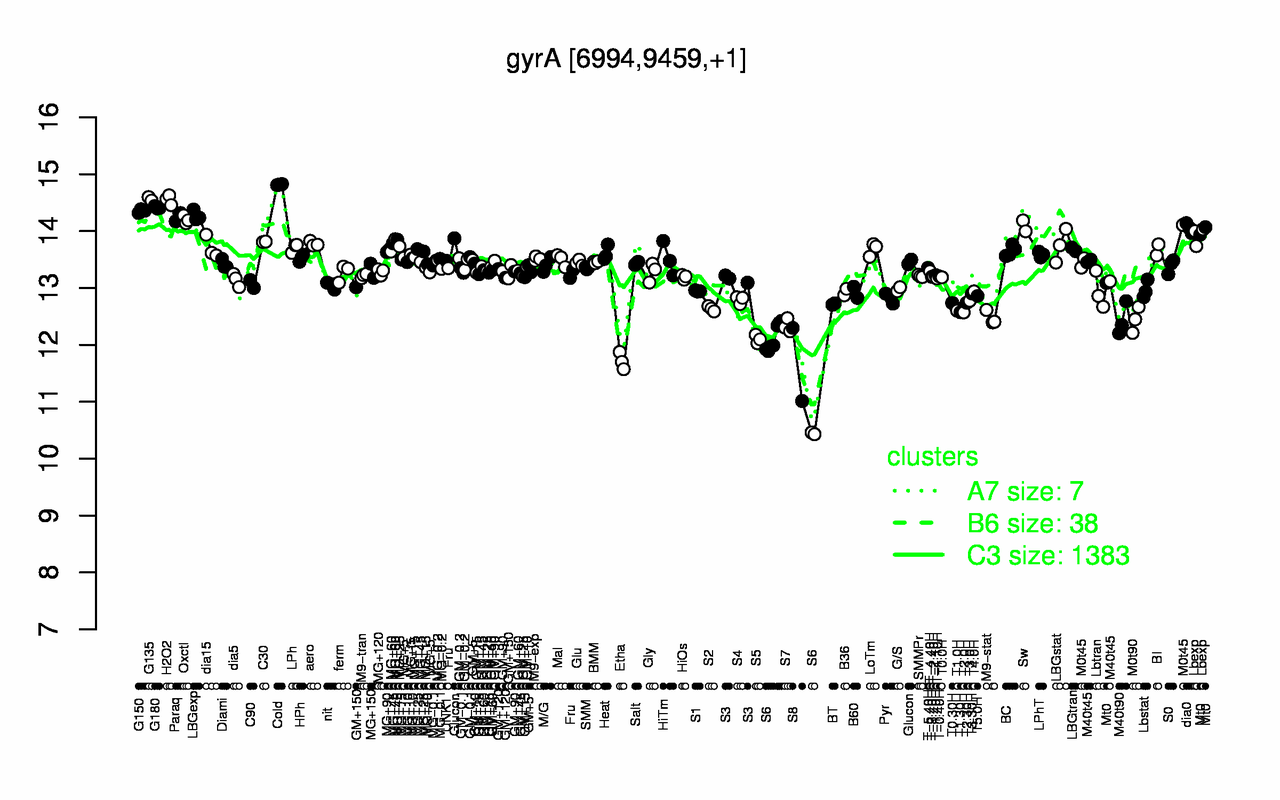
Highest Expression Conditions
Cold G135 H2O2 G180 G150 LBGexp Paraq Oxctl Sw dia0
14.8 14.6 14.5 14.4 14.4 14.3 14.2 14.2 14.1 14.1
Lowest Expression Conditions
S8 Etha S6 S5 S7 M40t90 M0t90 M9-stat T2.0H T1.30H
11.7 11.7 11.8 12.1 12.3 12.4 12.4 12.5 12.6 12.6
Most Positively Correlated Segments
gyrB yaaB nfo lepA recF ytgP recJ S6 rplGA ylxR
0.92 0.89 0.88 0.88 0.87 0.87 0.87 0.87 0.86 0.86
Most Negatively Correlated Segments
yhzD yjaZ yvaM ymzB ybbF phrI phy yqaC yusW ybbE
-0.77 -0.74 -0.73 -0.73 -0.72 -0.71 -0.71 -0.7 -0.69 -0.69
Expression Profile of Segment gyrA Show/Hide
Annotation of Gene gyrA Show/Hide
function
16.3: Control
function
16.2: Construct biomass (Anabolism)
function
16.9: Replicate
inference
ab initio prediction:AMIGene:2.0
codon_start
1
EC_number
5.99.1.3
transl_table
11
note
Evidence 1a: Function experimentally demonstrated in the studied strain; PubMedId: 12682299, 12767818, 17320901; Product type e: enzyme
db_xref
GI:2632274
product
DNA gyrase (subunit A)
protein_id
CAB11783.1
Genomic View of Gene/Segment gyrA Show/Hide
(Legend)