B. subtilis Expression Data Browser
Start Page
B. subtilis Expression Data Browser
Gene/Segment:
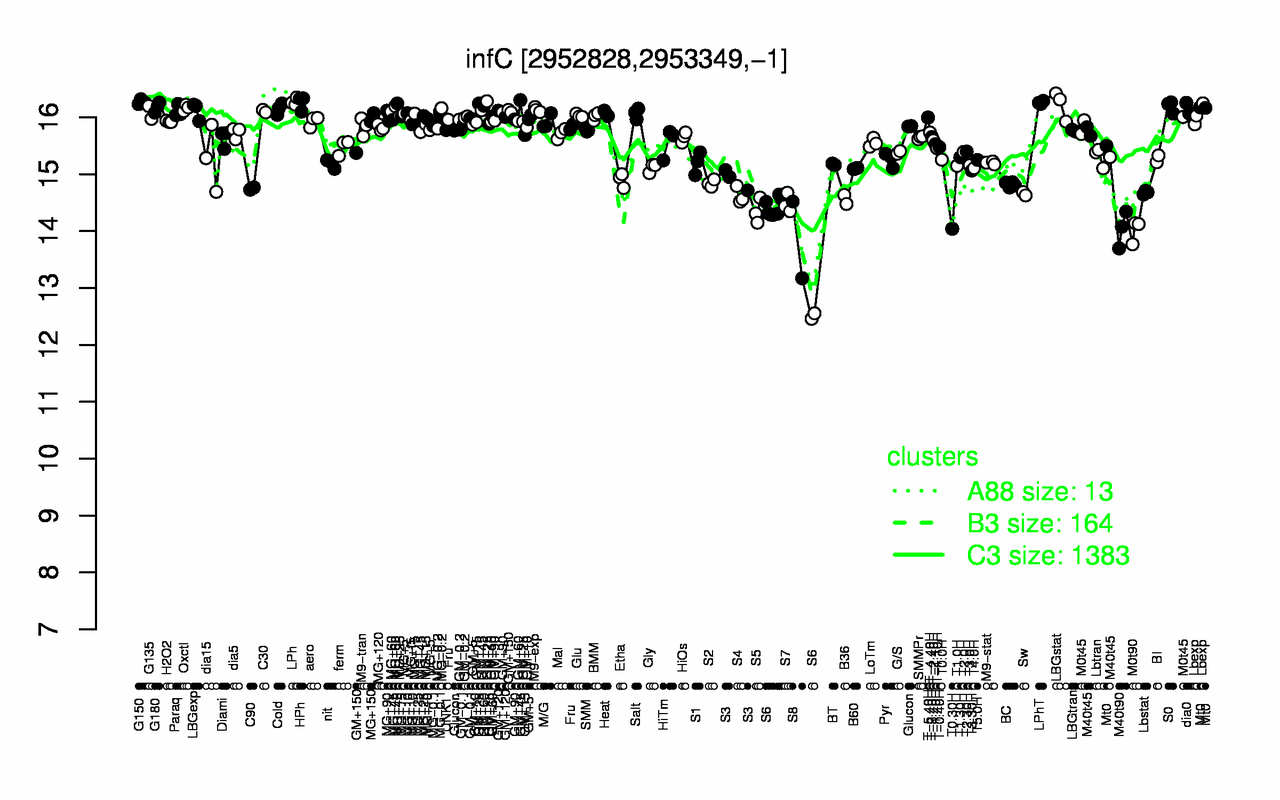
infC
Locus Tag:
BSU28870
Details about infC
Show/Hide
Highest Expression Conditions
LPh
G150
LPhT
HPh
LBGstat
S0
G180
Oxctl
GM+25
Cold
16.3
16.3
16.3
16.3
16.2
16.2
16.2
16.2
16.2
16.1
Lowest Expression Conditions
S8
S6
M0t90
M40t90
T0.30H
S5
S7
B36
S4
Sw
13.8
14
14
14
14
14.3
14.5
14.6
14.6
14.7
Most Positively Correlated Segments
rpmI
rplT
S50
rpsD
rpsF
S1135
rplJ
ylbN
rpsC
rplA
0.97
0.92
0.89
0.89
0.89
0.89
0.88
0.88
0.88
0.88
Most Negatively Correlated Segments
fadN
fadE
fadA
yugM
yugN
amyC
S727
sspH
S1195
malP
-0.81
-0.81
-0.81
-0.79
-0.79
-0.78
-0.78
-0.78
-0.78
-0.78
Expression Profile of Segment infC
Show/Hide
Annotation of Gene infC
Show/Hide
function
16.2: Construct biomass (Anabolism)
inference
ab initio prediction:AMIGene:2.0
codon_start
1
product
initiation factor IF-3
transl_table
11
note
Evidence 1a: Function experimentally demonstrated in the studied strain; PubMedId: 12682299, 17289755; Product type f: factor
db_xref
GI:2635352
protein_id
CAB14847.1
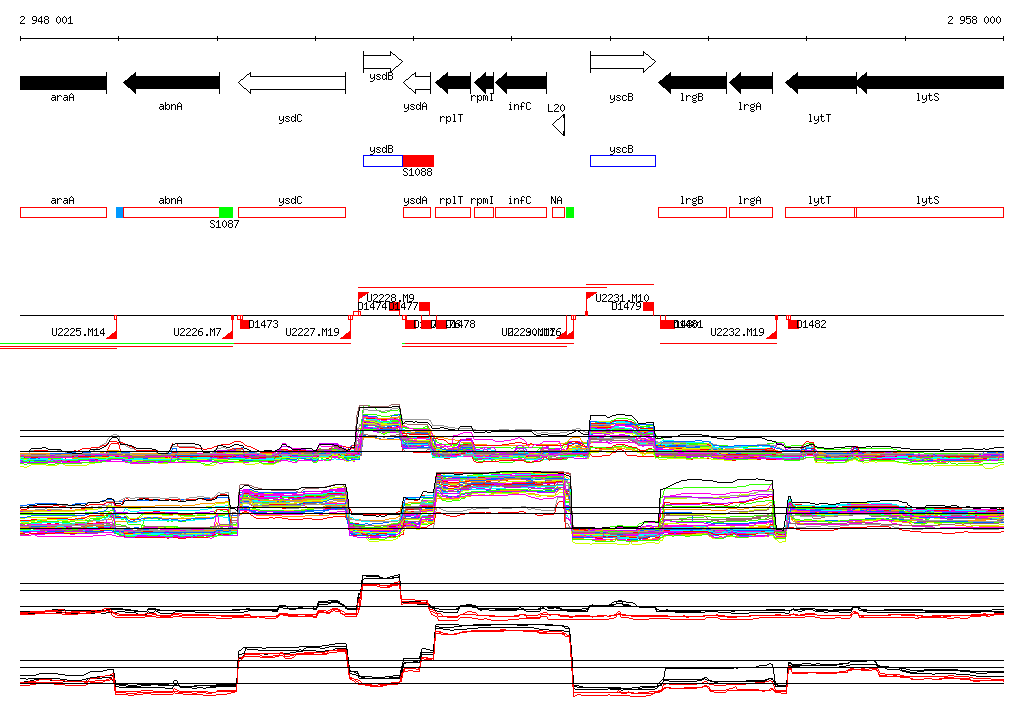
Genomic View of Gene/Segment infC
Show/Hide
(Legend)
Browse Genome Context