B. subtilis Expression Data Browser
Start Page
B. subtilis Expression Data Browser
Gene/Segment:
ispE
Locus Tag:
BSU00460
Details about ispE
Show/Hide
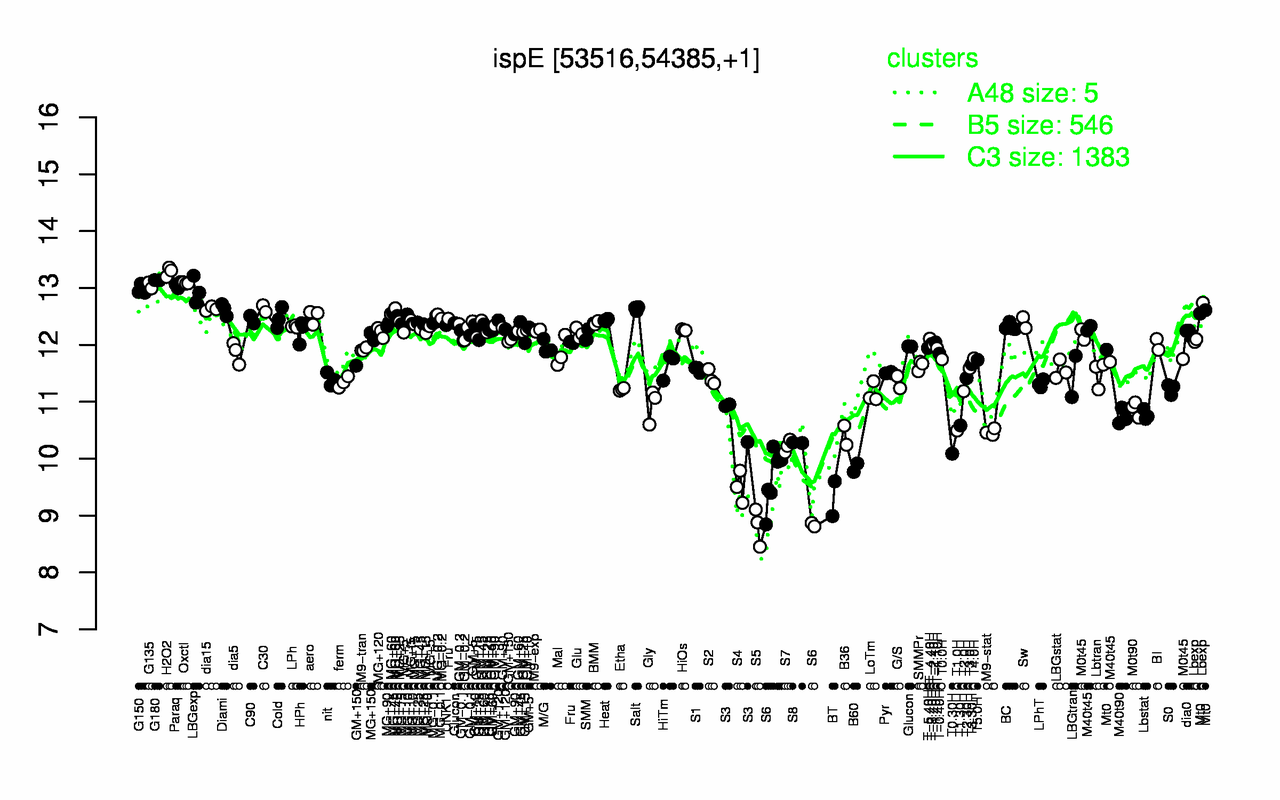
Highest Expression Conditions
H2O2
G180
Oxctl
Paraq
G135
G150
LBGexp
C30
Salt
dia15
13.3
13.1
13.1
13.1
13
13
13
12.6
12.6
12.6
Lowest Expression Conditions
S5
BT
S6
S4
B60
T0.30H
S7
S8
B36
M9-stat
8.81
9.3
9.5
9.5
9.84
10.1
10.2
10.3
10.4
10.5
Most Positively Correlated Segments
purR
oxaAA
ywfO
yaaA
ywdF
folEA
scpA
purU
spcB
jag
0.92
0.9
0.89
0.88
0.87
0.87
0.87
0.87
0.86
0.86
Most Negatively Correlated Segments
yhzD
S402
S1246
S738
yoyB
ytpI
yycO
yngI
yngHA
yqzG
-0.83
-0.83
-0.82
-0.82
-0.82
-0.81
-0.81
-0.8
-0.8
-0.8
Expression Profile of Segment ispE
Show/Hide
Annotation of Gene ispE
Show/Hide
function
16.2: Construct biomass (Anabolism)
inference
ab initio prediction:AMIGene:2.0
codon_start
1
EC_number
2.7.1.148
transl_table
11
note
Evidence 2a: Function of homologous gene experimentally demonstrated in an other organism; PubMedId: 11361082, 12682299, 12771135, 17458547; Product type e: enzyme
db_xref
GI:2632313
product
4-(cytidine 5'-diphospho)-2-C-methyl-D-erythritol kinase
protein_id
CAB11822.1
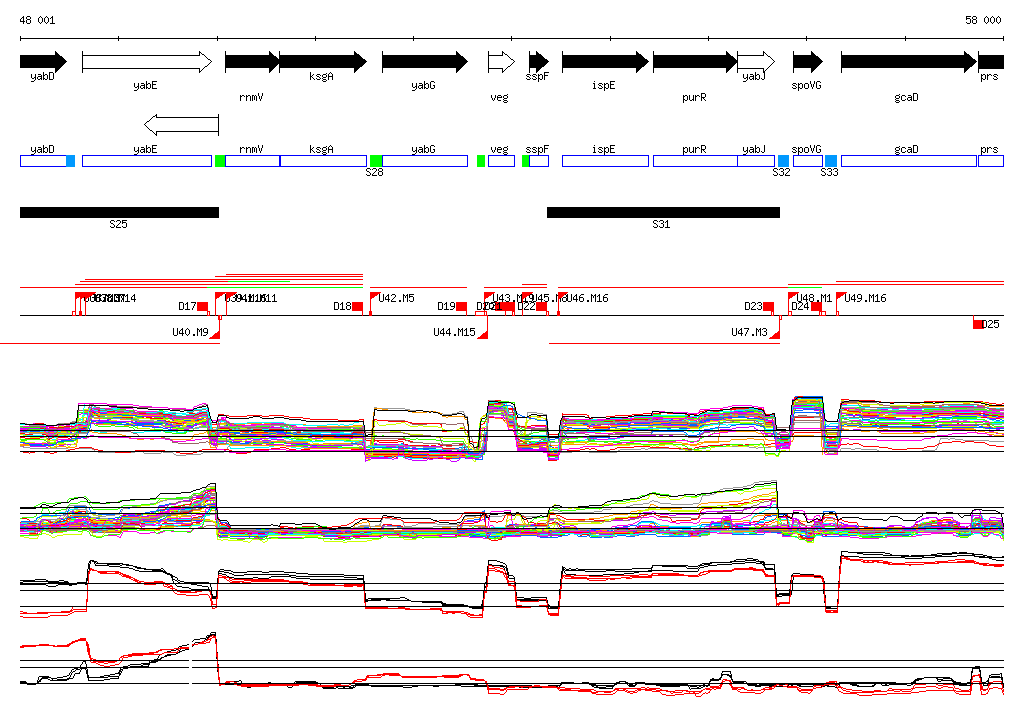
Genomic View of Gene/Segment ispE
Show/Hide
(Legend)
Browse Genome Context