| Start Page |
|
 |
| Start Page |
|
|
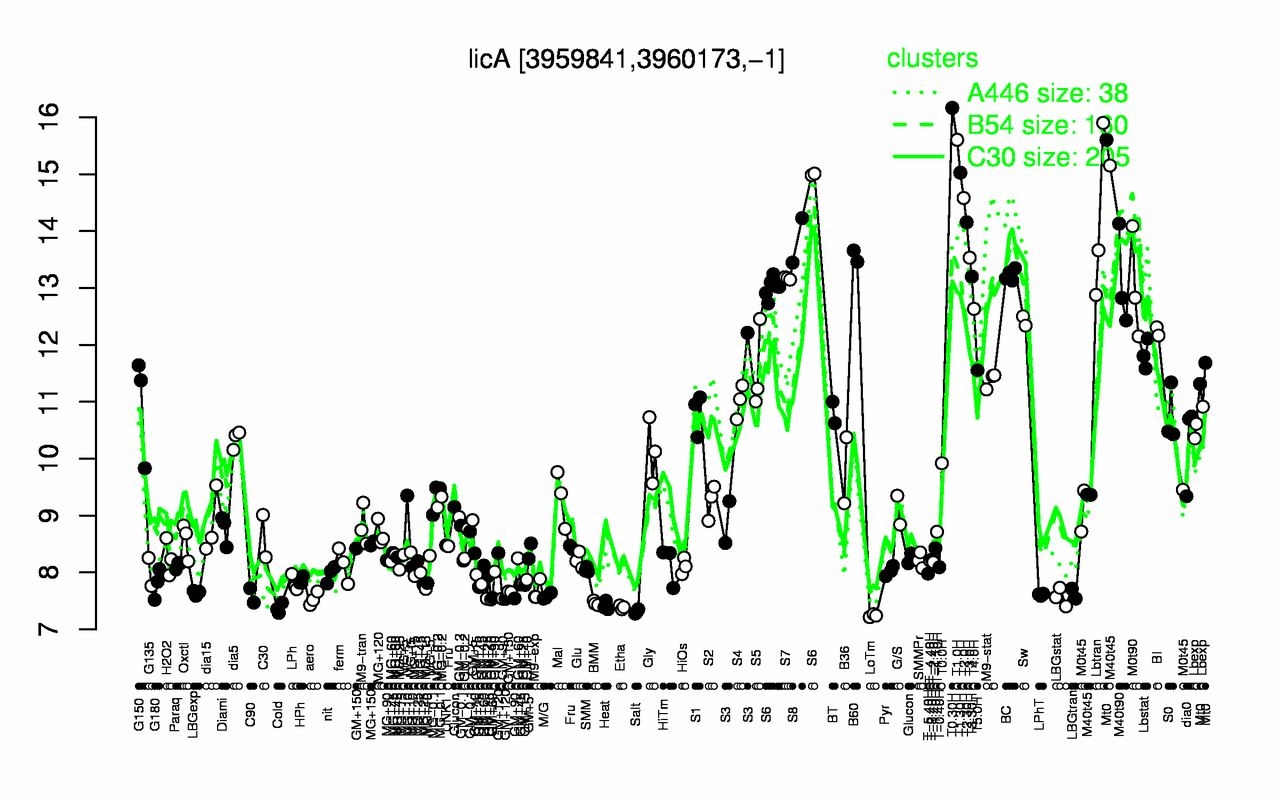
| T0.30H | T1.0H | T1.30H | T2.0H | T2.30H | Lbtran | S8 | B60 | T3.0H | S6 |
| 16.2 | 15.6 | 15 | 14.6 | 14.2 | 14.1 | 13.8 | 13.6 | 13.5 | 13.5 |
| LoTm | Salt | Cold | Etha | Heat | BMM | aero | LBGstat | M/G | C90 |
| 7.24 | 7.31 | 7.37 | 7.39 | 7.41 | 7.46 | 7.54 | 7.57 | 7.58 | 7.6 |