| Start Page |
|
 |
| Start Page |
|
|
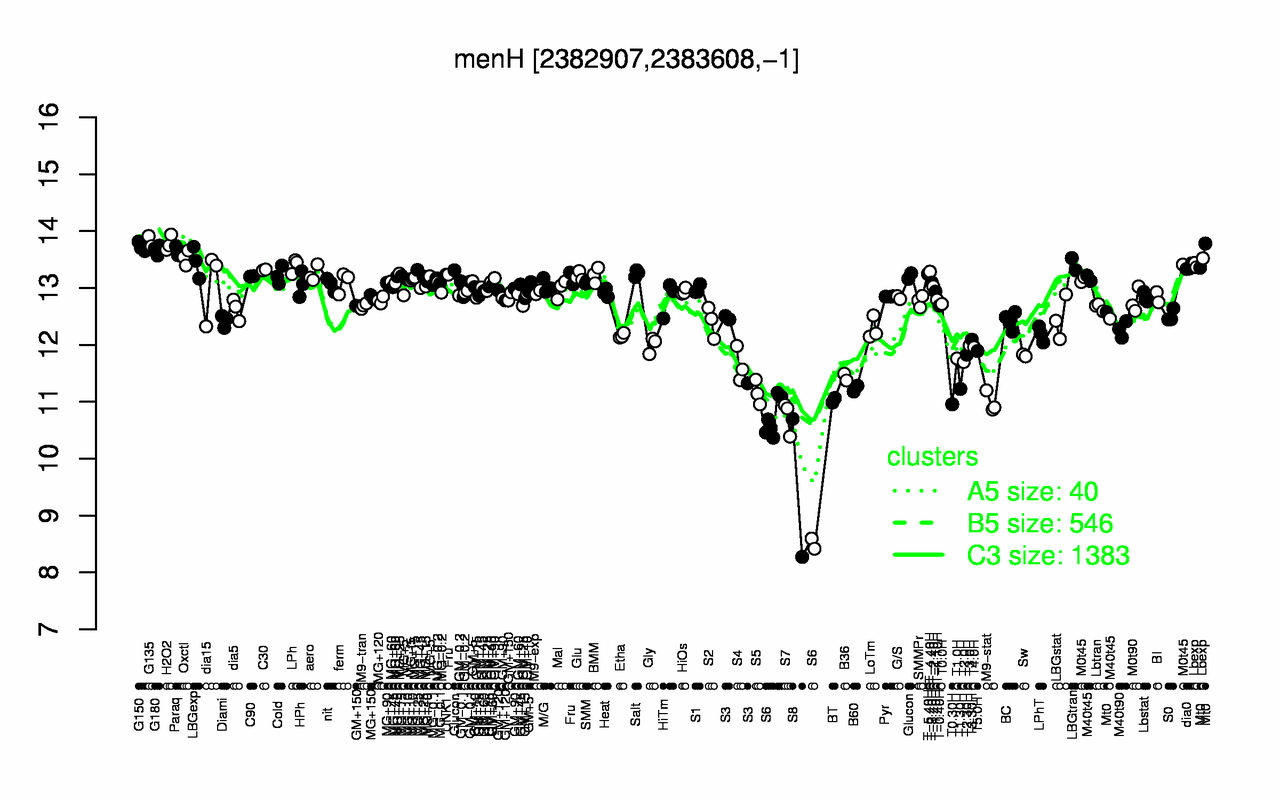
| G135 | H2O2 | G150 | G180 | Paraq | Oxctl | LBGexp | Lbexp | LBGtran | LPh |
| 13.8 | 13.8 | 13.7 | 13.7 | 13.7 | 13.5 | 13.5 | 13.4 | 13.4 | 13.4 |
| S8 | S6 | S7 | T0.30H | M9-stat | BT | S5 | T1.30H | B60 | B36 |
| 9.49 | 10.3 | 10.7 | 11 | 11 | 11 | 11.2 | 11.2 | 11.2 | 11.4 |