| Start Page |
|
 |
| Start Page |
|
|
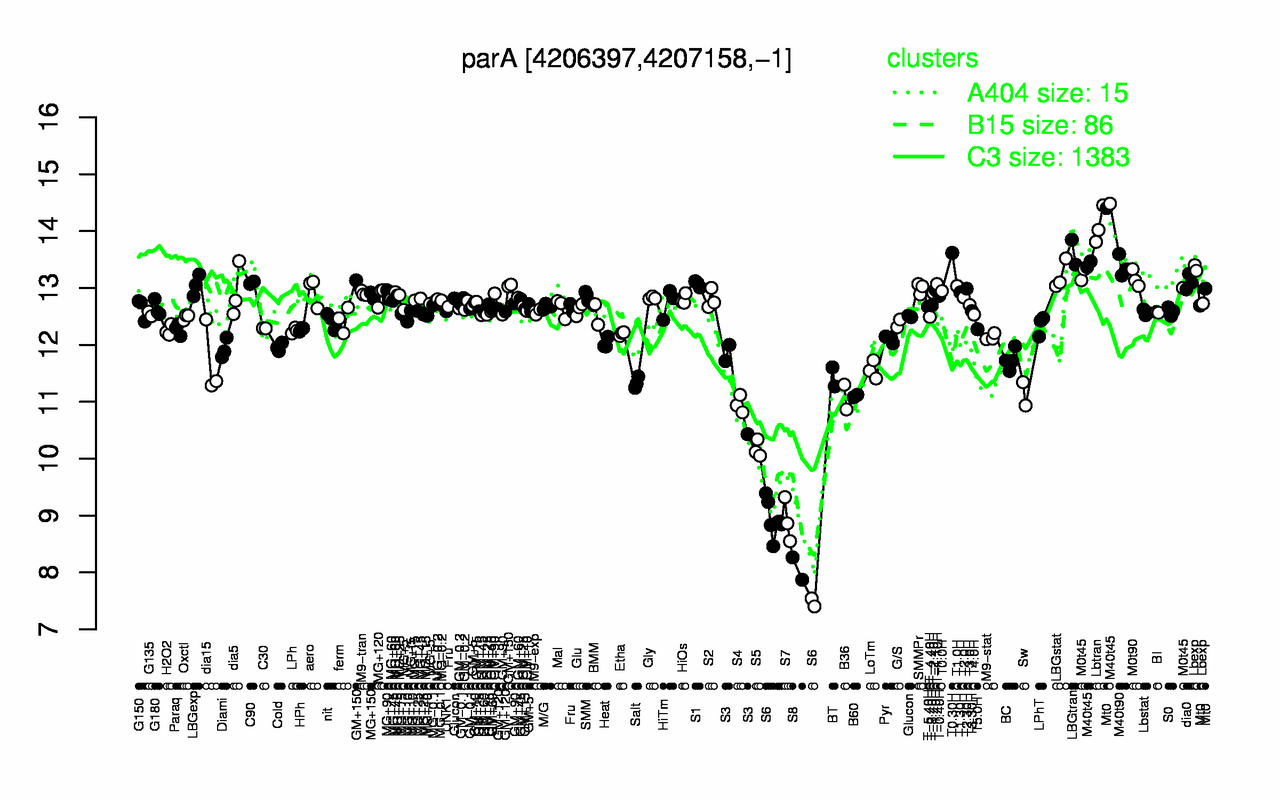
| Lbtran | M40t45 | LBGtran | T0.30H | M40t90 | Mt0 | LBGstat | M0t90 | M0t45 | Lbexp |
| 14.1 | 13.8 | 13.6 | 13.6 | 13.4 | 13.4 | 13.2 | 13.2 | 13.2 | 13.1 |
| S8 | S6 | S7 | S5 | S4 | B36 | B60 | Sw | Salt | S3 |
| 8.07 | 8.61 | 8.91 | 10.2 | 11 | 11.1 | 11.1 | 11.1 | 11.3 | 11.4 |