B. subtilis Expression Data Browser
Details about pbpC Show/Hide
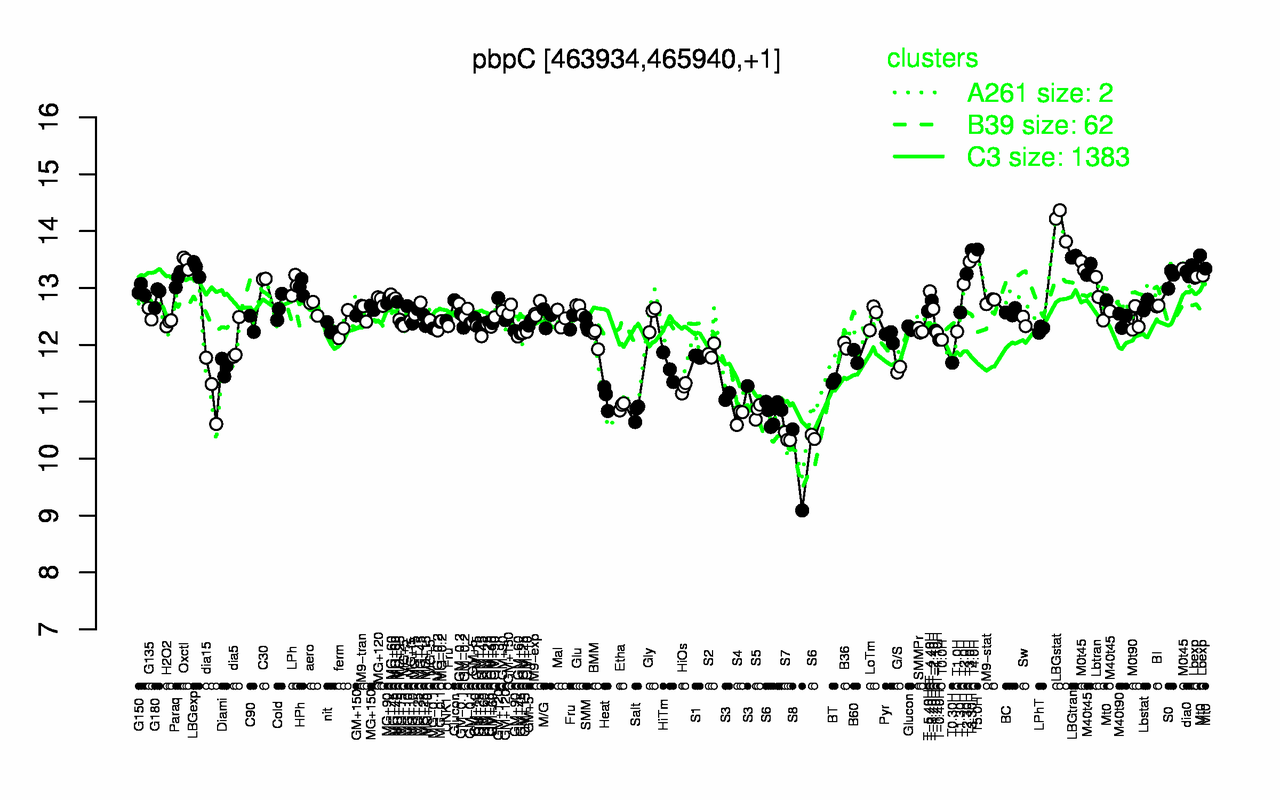
Highest Expression Conditions
LBGstat T5.0H T3.30H T4.0H LBGtran T3.0H Oxctl M0t45 LBGexp dia0
14.1 13.7 13.7 13.6 13.6 13.5 13.5 13.4 13.3 13.3
Lowest Expression Conditions
S8 S7 S6 S4 Salt S5 Etha Heat S3 dia15
9.8 10.4 10.7 10.7 10.8 10.8 10.9 11.1 11.2 11.2
Most Positively Correlated Segments
S137 bmrA S1328 galE lytT rluB S1321 ykpA ymdB pbpD
0.9 0.83 0.81 0.79 0.78 0.77 0.77 0.76 0.76 0.75
Most Negatively Correlated Segments
yusW yhjQ yozE ymzB yetO S147 yumB S1223 S318 yojJ
-0.73 -0.73 -0.72 -0.71 -0.7 -0.7 -0.7 -0.7 -0.69 -0.69
Expression Profile of Segment pbpC Show/Hide
Annotation of Gene pbpC Show/Hide
function
16.13: Shape
function
16.2: Construct biomass (Anabolism)
inference
ab initio prediction:AMIGene:2.0
codon_start
1
product
penicillin-binding lipoprotein 3
transl_table
11
note
Evidence 1a: Function experimentally demonstrated in the studied strain; PubMedId: 8830698; Product type lp: lipoprotein
db_xref
GI:2632714
protein_id
CAB12221.1
Genomic View of Gene/Segment pbpC Show/Hide
(Legend)