| Start Page |
|
 |
| Start Page |
|
|
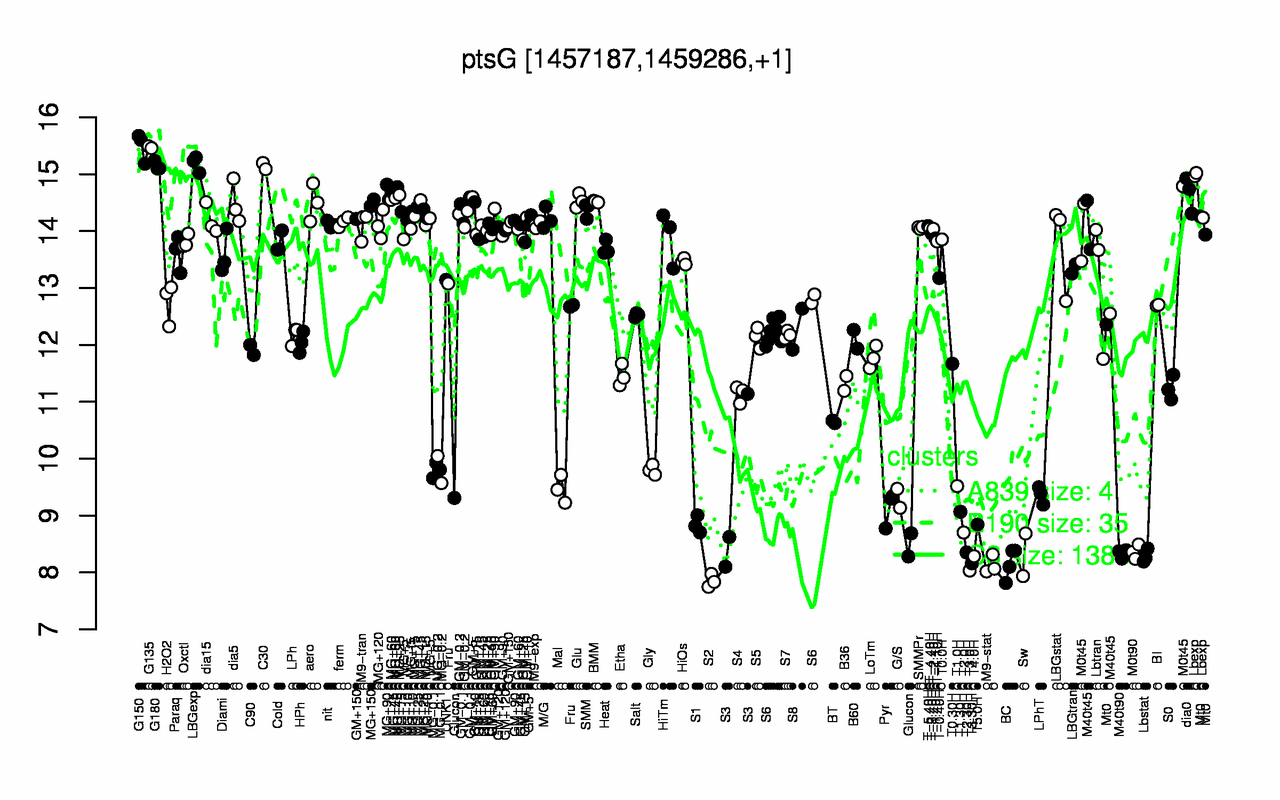
| G150 | G135 | LBGexp | G180 | C30 | Lbexp | MG+90 | MG+45 | dia0 | MG+60 |
| 15.5 | 15.5 | 15.2 | 15.1 | 15.1 | 14.7 | 14.7 | 14.7 | 14.7 | 14.6 |
| S2 | T3.0H | M9-stat | T3.30H | BC | T4.0H | Lbstat | Sw | M40t90 | T2.30H |
| 7.85 | 8.03 | 8.13 | 8.16 | 8.17 | 8.28 | 8.29 | 8.31 | 8.34 | 8.35 |