| Start Page |
|
 |
| Start Page |
|
|
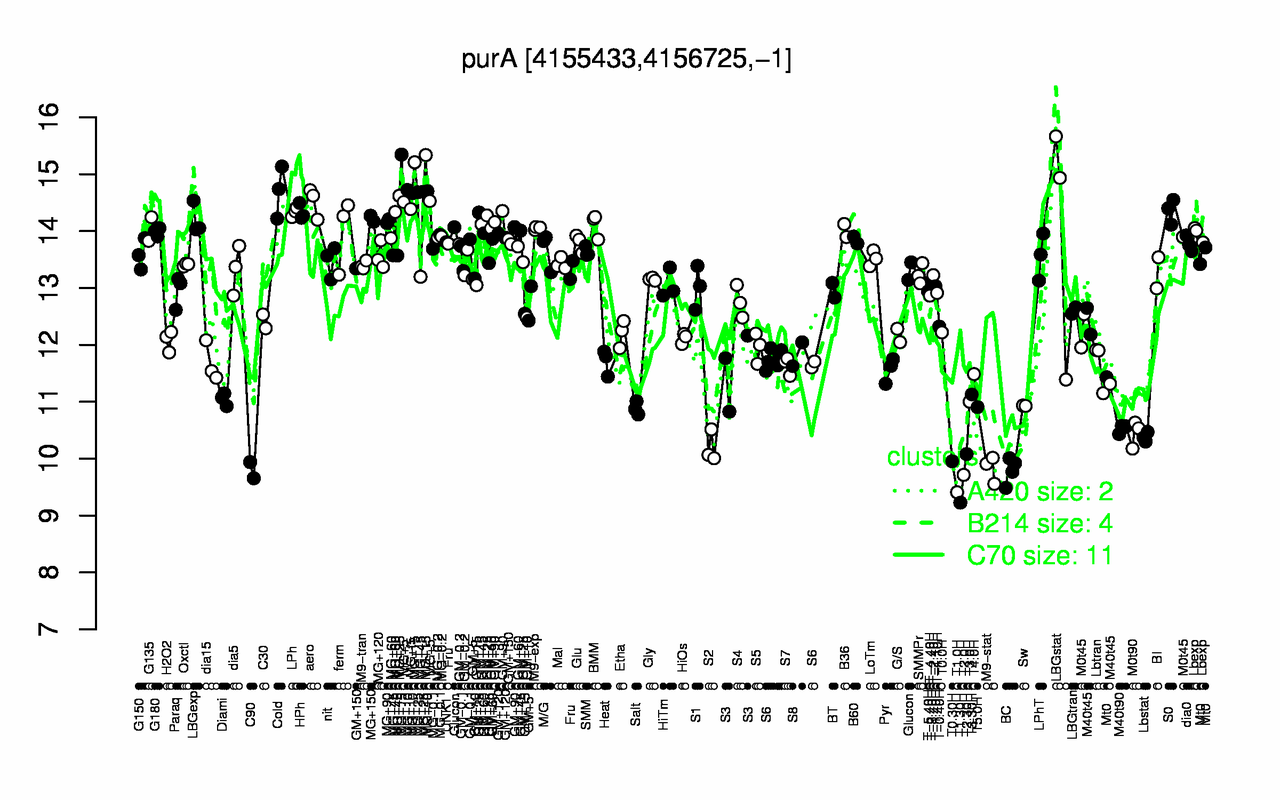
| MG+15 | Cold | MG+10 | MG+25 | MG+5 | aero | MG+t5 | S0 | LPh | HPh |
| 15.3 | 14.7 | 14.7 | 14.7 | 14.5 | 14.5 | 14.4 | 14.4 | 14.3 | 14.3 |
| T1.30H | T1.0H | T2.0H | BC | C90 | M9-stat | T0.30H | T2.30H | S2 | Lbstat |
| 9.23 | 9.41 | 9.72 | 9.8 | 9.8 | 9.83 | 9.95 | 10.1 | 10.2 | 10.4 |