| Start Page |
|
 |
| Start Page |
|
|
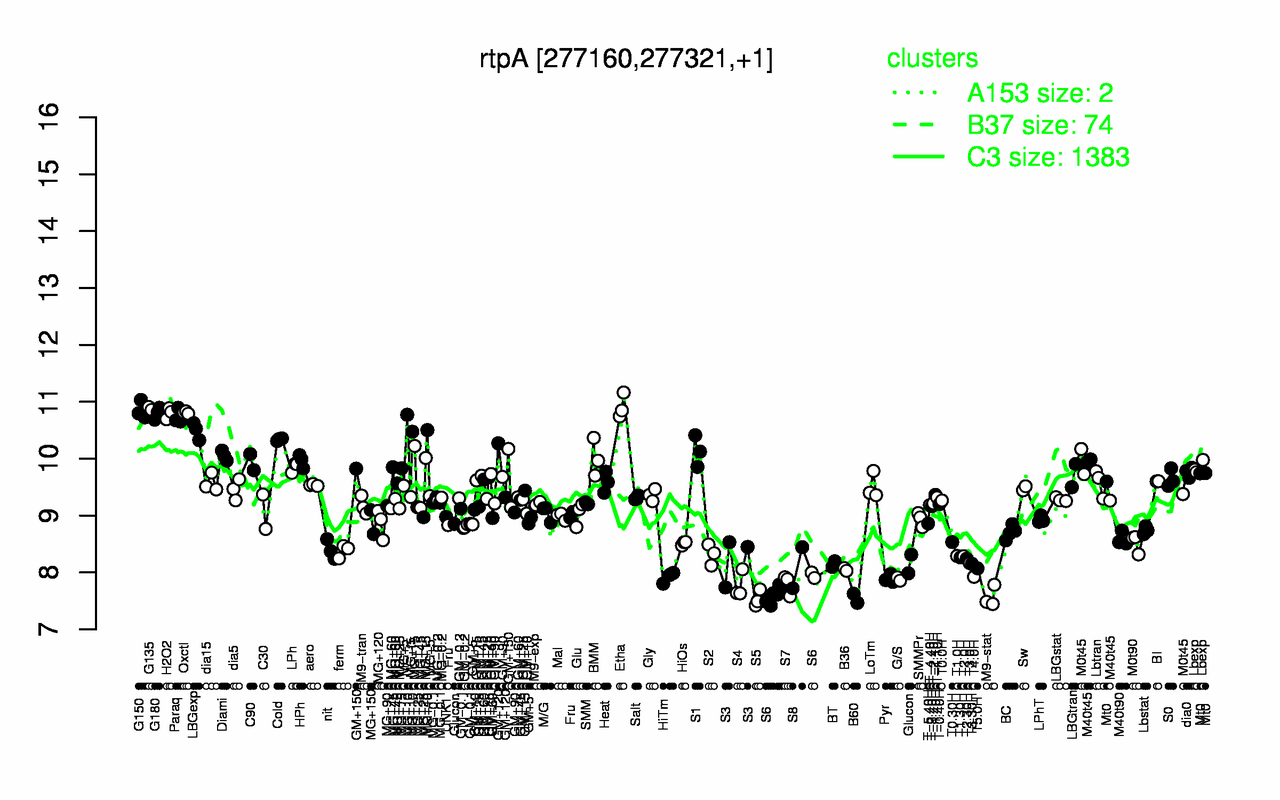
| Etha | G135 | G150 | Oxctl | H2O2 | G180 | Paraq | MG+10 | LBGexp | Cold |
| 10.9 | 10.9 | 10.9 | 10.8 | 10.8 | 10.8 | 10.7 | 10.6 | 10.5 | 10.3 |
| S5 | B60 | M9-stat | S6 | S4 | S7 | G/S | Pyr | HiTm | T4.0H |
| 7.54 | 7.55 | 7.57 | 7.68 | 7.78 | 7.79 | 7.88 | 7.89 | 7.92 | 7.92 |