B. subtilis Expression Data Browser
Start Page
B. subtilis Expression Data Browser
Gene/Segment:
sipS
Locus Tag:
BSU23310
Details about sipS
Show/Hide
Highest Expression Conditions
BC
T3.0H
T4.0H
T2.30H
T5.0H
T3.30H
Sw
T2.0H
M9-stat
C90
14.5
14.4
14.4
14.4
14.3
14.2
14.2
14
14
13.8
Lowest Expression Conditions
S6
S5
S8
S7
S4
S0
S3
BT
HiTm
LBGtran
11.1
11.2
11.3
11.6
11.6
11.8
11.9
12
12.1
12.1
Most Positively Correlated Segments
yngC
ydzW
ydzW
ymdA
ydzW
yheN
ypjP
ydzW
ydzW
kinD
0.8
0.77
0.76
0.76
0.75
0.75
0.75
0.74
0.74
0.74
Most Negatively Correlated Segments
yqgO
ywoC
ytwI
spoVT
S518
gerAC
ypbQ
yrrI
yoaU
S1177
-0.71
-0.66
-0.66
-0.66
-0.65
-0.65
-0.65
-0.64
-0.64
-0.64
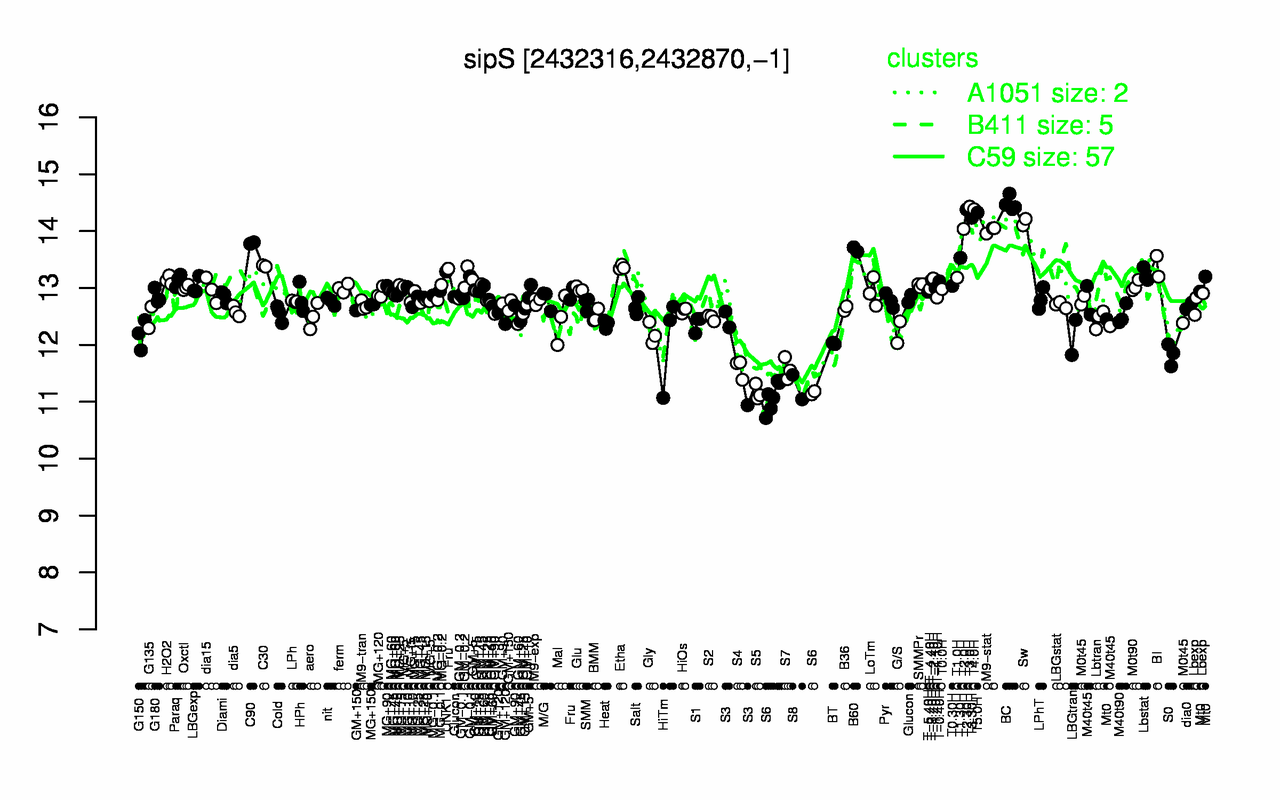
Expression Profile of Segment sipS
Show/Hide
Annotation of Gene sipS
Show/Hide
function
16.2: Construct biomass (Anabolism)
function
16.6: Maintain
inference
ab initio prediction:AMIGene:2.0
codon_start
1
EC_number
3.4.21.89
transl_table
11
note
Evidence 1a: Function experimentally demonstrated in the studied strain; PubMedId: 15502345, 11004175, 10982814, 9694797, 9823656, 10198007, 10336490; Product type e: enzyme
db_xref
GI:2634766
product
type I signal peptidase
protein_id
CAB14263.1
Genomic View of Gene/Segment sipS
Show/Hide
(Legend)
Browse Genome Context