| Start Page |
|
 |
| Start Page |
|
|
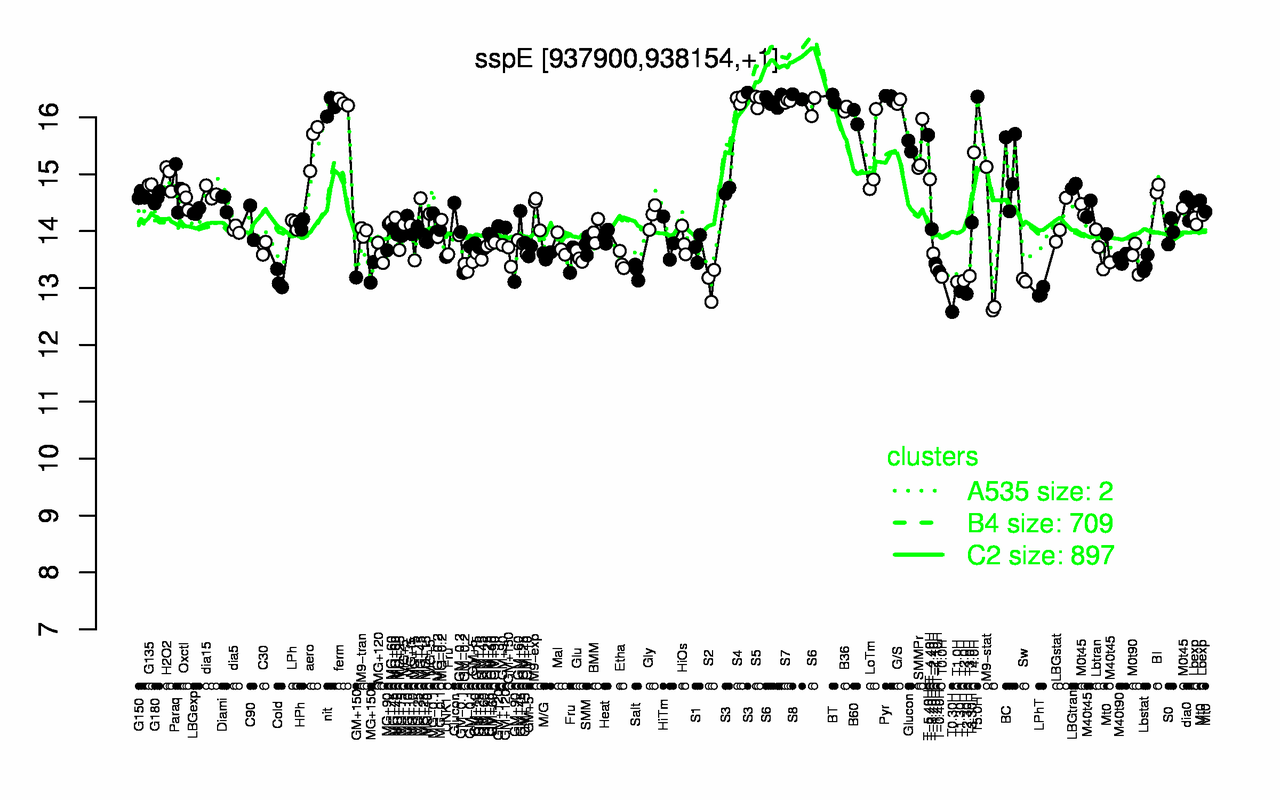
| T5.0H | S8 | Pyr | BT | S4 | S5 | S7 | G/S | ferm | S6 |
| 16.4 | 16.4 | 16.3 | 16.3 | 16.3 | 16.3 | 16.3 | 16.3 | 16.3 | 16.3 |
| T0.30H | T2.30H | LPhT | T1.30H | S2 | T1.0H | T2.0H | Sw | Cold | T0.0H |
| 12.6 | 12.9 | 12.9 | 12.9 | 13.1 | 13.1 | 13.1 | 13.1 | 13.1 | 13.2 |