| Start Page |
|
 |
| Start Page |
|
|
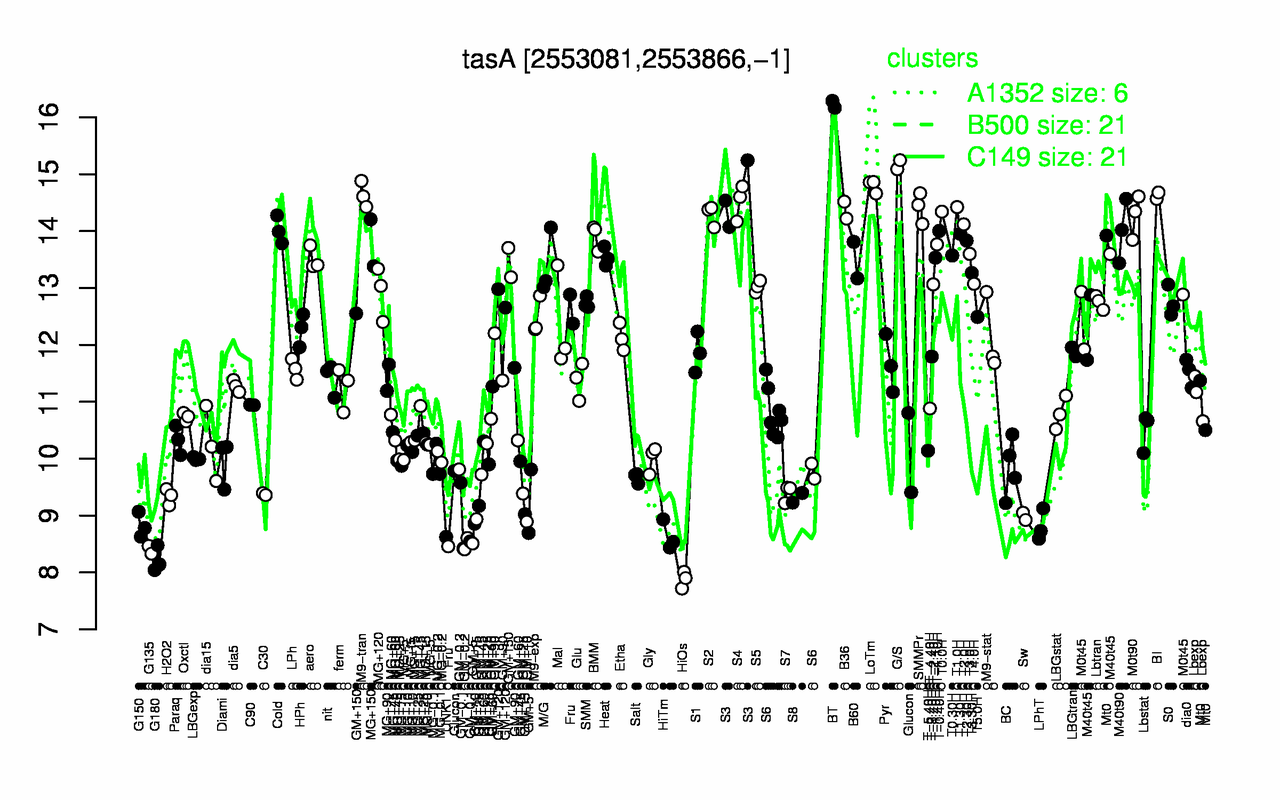
| BT | G/S | LoTm | M9-tran | BI | S3 | S4 | T1.0H | SMMPr | B36 |
| 16.2 | 15.2 | 14.8 | 14.6 | 14.6 | 14.6 | 14.5 | 14.4 | 14.4 | 14.4 |
| HiOs | G180 | G135 | UNK1 | HiTm | LPhT | G150 | GM-0.1 | GM+10 | GM-0.2 |
| 7.88 | 8.22 | 8.4 | 8.62 | 8.64 | 8.82 | 8.83 | 8.85 | 8.87 | 8.94 |