| Start Page |
|
 |
| Start Page |
|
|
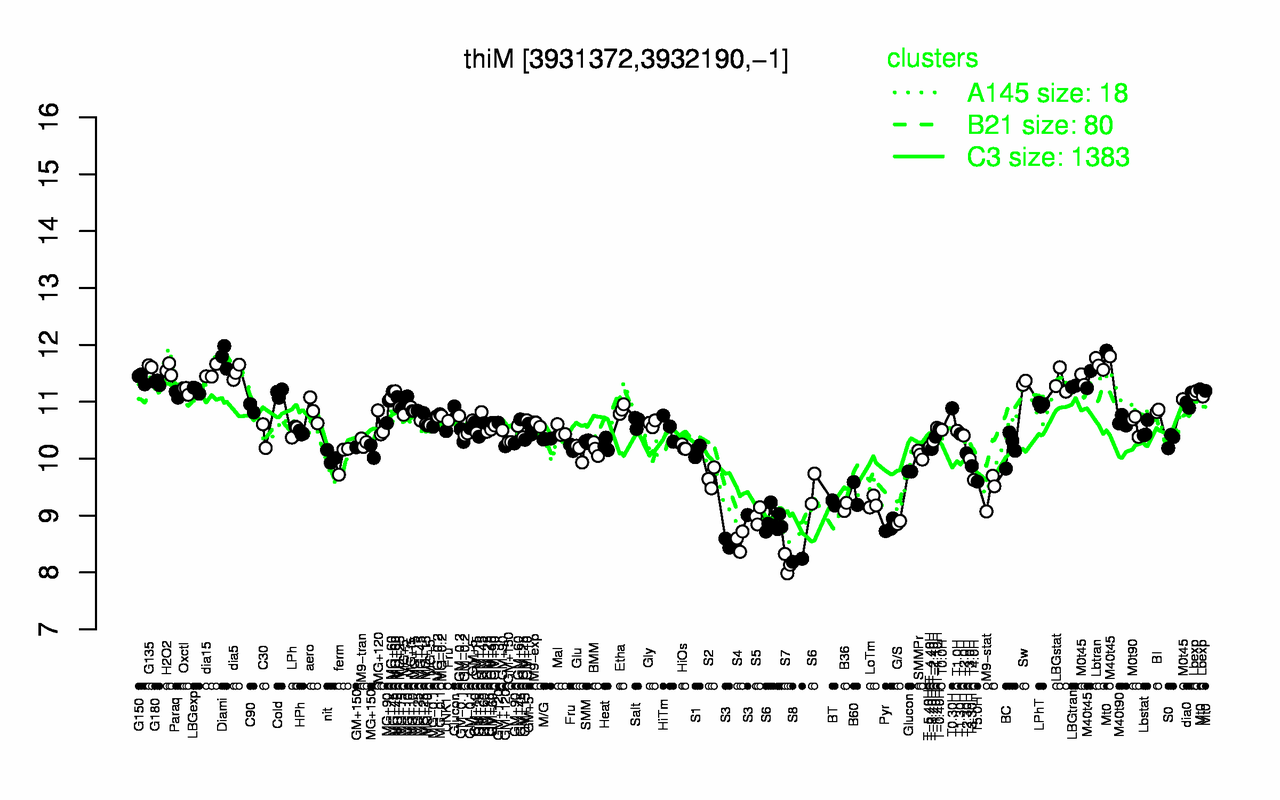
| Diami | Lbtran | G135 | H2O2 | M40t45 | dia15 | dia5 | Mt0 | G150 | LBGstat |
| 11.8 | 11.7 | 11.6 | 11.6 | 11.5 | 11.5 | 11.5 | 11.4 | 11.4 | 11.4 |
| S7 | S8 | S4 | S3 | Pyr | G/S | S5 | S6 | B36 | BT |
| 8.15 | 8.21 | 8.56 | 8.68 | 8.81 | 8.88 | 8.99 | 9.02 | 9.15 | 9.22 |