| Start Page |
|
 |
| Start Page |
|
|
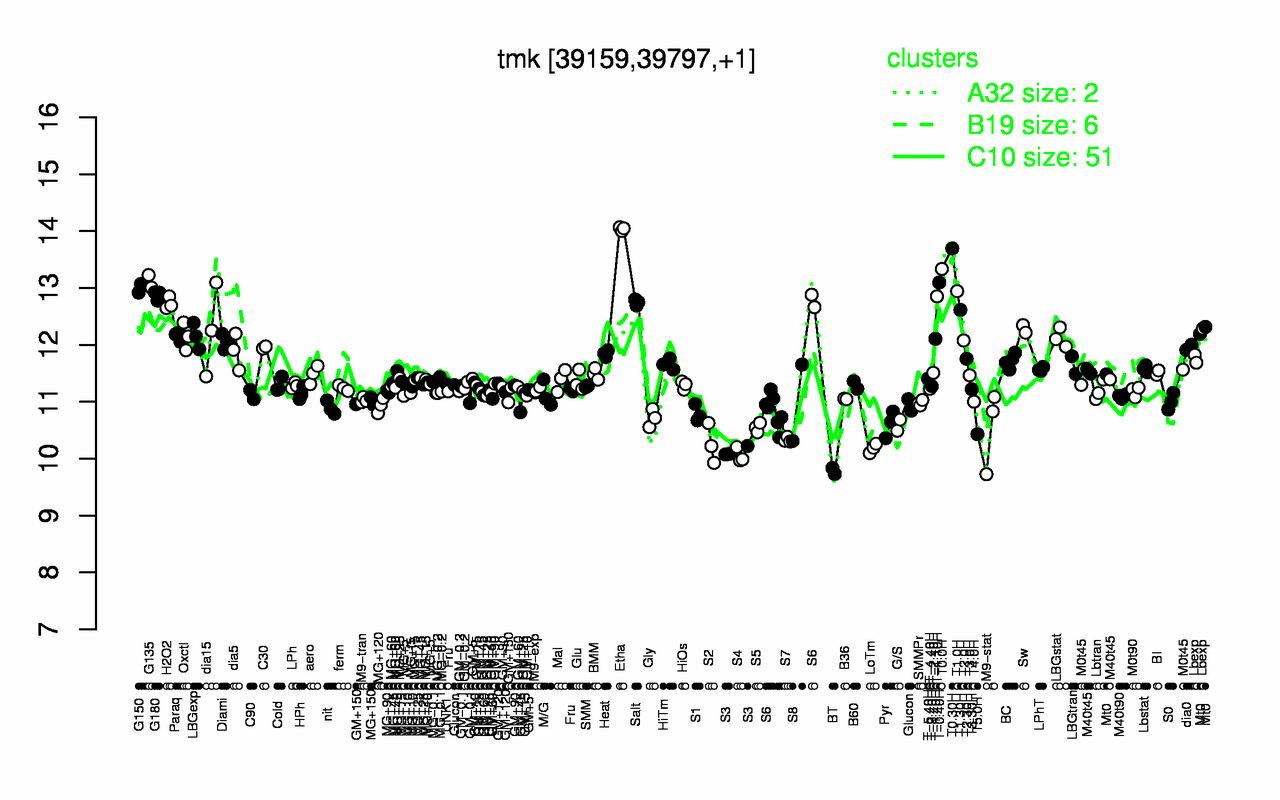
| Etha | T0.30H | T0.0H | G135 | T-0.40H | G150 | T1.0H | G180 | T-1.10H | Salt |
| 14 | 13.7 | 13.3 | 13.1 | 13.1 | 13 | 12.9 | 12.9 | 12.9 | 12.7 |
| BT | S4 | S3 | LoTm | S2 | S7 | T5.0H | S5 | M9-stat | G/S |
| 9.78 | 10.1 | 10.1 | 10.2 | 10.3 | 10.3 | 10.4 | 10.5 | 10.5 | 10.6 |