| Start Page |
|
 |
| Start Page |
|
|
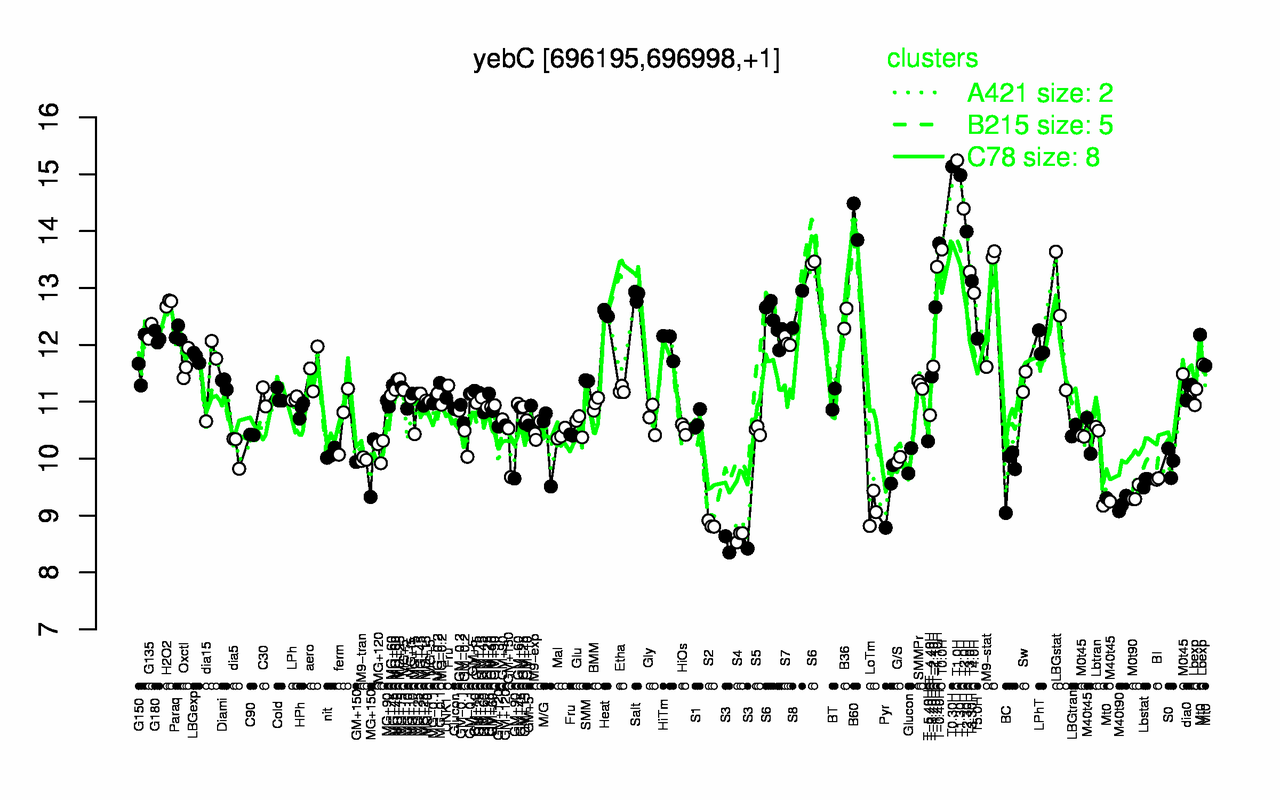
| T1.0H | T0.30H | T1.30H | T2.0H | B60 | T2.30H | T-0.40H | T0.0H | T-1.10H | T3.0H |
| 15.2 | 15.1 | 15 | 14.4 | 14.2 | 14 | 13.8 | 13.7 | 13.4 | 13.3 |
| S3 | S4 | S2 | LoTm | M40t90 | M0t90 | Pyr | Lbstat | BI | BC |
| 8.47 | 8.64 | 8.84 | 9.1 | 9.2 | 9.37 | 9.41 | 9.59 | 9.64 | 9.75 |