B. subtilis Expression Data Browser
Start Page
B. subtilis Expression Data Browser
Gene/Segment:
yhcM
Locus Tag:
BSU09140
Details about yhcM
Show/Hide
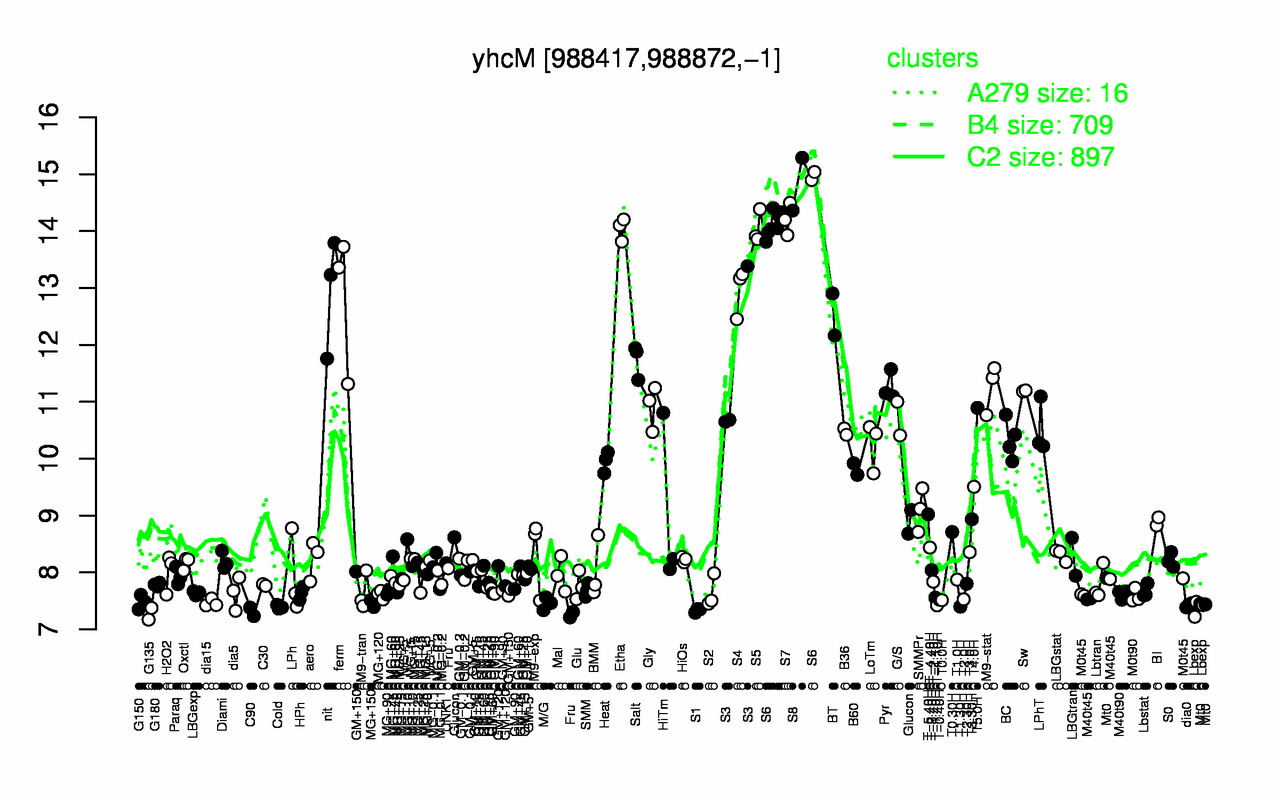
Highest Expression Conditions
S8
S6
S7
S5
Etha
S4
nit
ferm
BT
Salt
14.8
14.3
14.2
14.1
14
13
12.9
12.8
12.5
11.7
Lowest Expression Conditions
G135
C90
S1
Lbexp
Cold
T1.30H
T-1.10H
dia0
MG+150
M/G
7.27
7.31
7.33
7.38
7.39
7.4
7.42
7.43
7.45
7.45
Most Positively Correlated Segments
yuzA
yfkD
yfhD
S1136
S318
yojJ
yraD
tlp
yraG
yhfM
0.97
0.95
0.95
0.93
0.93
0.92
0.92
0.92
0.92
0.92
Most Negatively Correlated Segments
ycbN
nosA
S1321
yeaD
yvcQ
S263
yvcP
sfp
pbpD
sfp
-0.85
-0.84
-0.83
-0.83
-0.83
-0.82
-0.82
-0.82
-0.82
-0.81
Expression Profile of Segment yhcM
Show/Hide
Annotation of Gene yhcM
Show/Hide
inference
ab initio prediction:AMIGene:2.0
codon_start
1
product
hypothetical protein
transl_table
11
note
Evidence 5: No homology to any previously reported sequences
db_xref
GI:2633237
protein_id
CAB12742.1
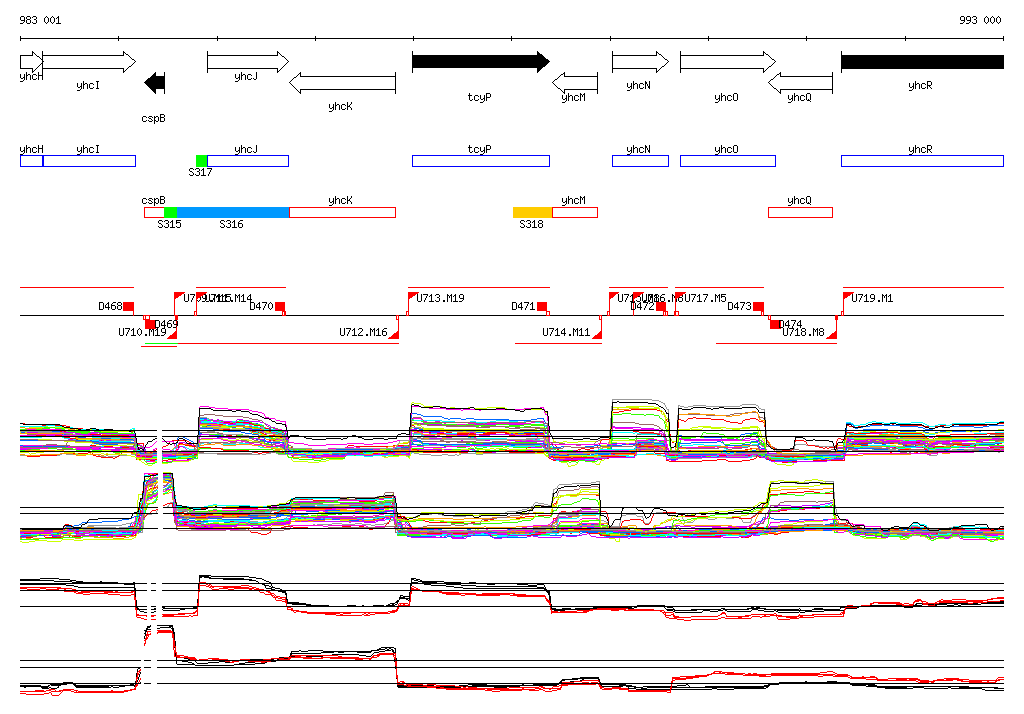
Genomic View of Gene/Segment yhcM
Show/Hide
(Legend)
Browse Genome Context